Last year, I shared a select few essays from my time as an MA student at King’s College London in 2023(MA International Political Economy). I have decided to publish the remainder of those essays on my blog, including now my dissertation – unfortunately my weakest piece of work for the whole year, to the point of costing me a distinction overall in the degree. It’s in the past now, but it was disappointing at the time.
The methodology was weak, analysis was not focussed enough – nonetheless, I feel that discussions of alternatives to growth economics remain so limited that it’s still worthwhile me sharing my flawed work on the topic.
Contents
2. Understanding degrowth and steady state economics. 1
Historical warnings of overconsumption. 1
The logic of excess and the growth problem. 2
An economy separate from its material base. 2
Steady state economics and degrowth. 3
Institutions of a degrowth economy. 7
5. Throughput and services. 18
Problems of modelling throughput and services. 18
Throughput and services in Japan. 20
1. Introduction
Dramatic economic change is necessary if we are to avert the worst of climate change (Stern, 2006) but there is growing doubt that the growth economy has the tools required to rapidly address it (Hickel, 2020; Latouche, 2009; Taylor, 2015). While green growth responses remain in practice the predominant force in policymaking, research suggests they are not effective enough or are even contradictory to their aims (Hickel, 2020; Jackson, 2011; Schneider et al, 2010). the need to explore socially transformative economic ideas prioritising ecological sustainability is therefore more pressing than ever.
Degrowth and the steady state economy are preeminent ideas in post-growth studies (Schneider et al, 2010). These models have inspired heated debate but have not actively taken shape in any economy globally. The steady state literature has up to this point remained widely theoretical. Without any countries attempting to organize on an SSE model, it is challenging to analyse how it functions practically. There is however value in identifying economies that loosely fit the key conditions of an SSE model and analysing how effectively the given country operates under those conditions. This should ease the process of deciding how effectively the SSE model poses a realistic green alternative to the growth economy, without any true examples to analyse.
This study identified Japan as a close fit to how Daly (1992) envisioned the macro conditions of a theoretical SSE, with its flatlining population and near to 0% GDP growth. The following research therefore opted to use Japan as a proxy for exploring SSE dynamics in practice and the utility of Daly’s (1992) SSE model on a national basis. This study asks to what extent a theoretical steady state economy (SSE) could function given the existing global economic system. It attempts to present key economic indicators in terms of Daly’s (1992) stocks, throughput and services and explores implications of describing an economy using this model.
This paper is divided into four sections. Firstly it provides an overview of degrowth and steady state debates, highlighting their relevance to the wider climate debate. It then explains the methodology designed to carry out the following analysis sections. The third and fourth sections analyse the Japanese macroeconomy in SSE terms, firstly focussing on Daly’s (1992) concept of ‘stocks’, then throughput and services collectively. It finds that the SSE model risks creating social and economic pressures that would be difficult to manage without a growth mechanism. The utility of the SSE model is constrained by the economic tools available to us. Designed to operate within the growth economy, fundamental differences in theoretical vision – especially regarding economic flows – mean that a series of new indicators and analytical tools are required to analyse SSE dynamics meaningfully.
2. Understanding degrowth and steady state economics
Historical warnings of overconsumption
For almost as long as political economy has existed, thinkers have warned of physical limits to the economy and the risks of overconsumption. Malthus (1798) was concerned about the economic limits of population growth, believing that as population rises, the risk of exceeding the economy’s capability to produce sufficient food increases. Jevons (1865) showed the connection between coal and the industrial-led growth of his time, and attempted to highlight that the economy was chained to the gradual depletion of coal. Mill (1848) hinted at believing in physical limits to the economy when he stated that humans should be “content to be stationary, long before necessity compels them to it.”
The debate on economic limits has returned and is oriented towards ecological limitations. The publication of the limits to growth (Meadows et al, 1972) brought discussion of the limits of human natural resource use to a global level. The report concluded that with continued levels of growth in five identified factors the ‘limits to growth’ would be reached within 100 years. Since the report was published half that time has passed.
The Stern Review (Stern, 2006) shifted the debate away from growth and towards emissions. It also warned of the irreversible risks of a business-as-usual approach to the environment, but where the Club of Rome linked emissions to GDP growth, the Stern Review proposed that this link could be decoupled. The report supports utilising carbon taxes and credits as incentives in this transition, as does the UNFCC (2018). While the effectiveness of decoupling is open to debate both Limits to Growth and the Stern Review emphasise that an early response is essential – for the latter in outweighing costs of climate change, and for the former averting collapse.
The logic of excess and the growth problem
Faith in growth and development is not shared by all (Hickel, 2020; Hueting, 2010; Jackson, 2011; Latouche, 2009; Taylor, 2015). Latouche describes the growth-oriented economy as a “logic of excess” (2009, pp.28) and states we must urgently offer an alternative to “the insanity of the growth society”.
Hickel (2020) argues that the decoupling logic proposed by green growth supporters cannot reverse the existing ecological overshoot. Continued expansion is degrading the ecosystem, so a more efficient appropriation of resources does not address the problem. While some slowing in emissions growth is visible (IEA, 2023; Zhu and Jiang, 2019) decoupling has thus far not proven effective enough and the scale of decoupling required remains underestimated (Jackson, 2011; Schneider et al, 2010). while a growth economy that coexists with a sustainable environment is conceivable, it is implausible. It would require considerably cleaner (and cheaper) technology, total substitution of non-renewable sources, and sufficient space left to nature. Achieving this for every facet of human life is unlikely (Hueting, 2010).
GDP growth correlates with rising inequality (Jackson, 2011; Piketty, 2013). Income distribution, according to Hickel, is part of the problem, the disproportionate purchasing power of the wealthiest in society resulting in extreme overconsumption and setting a precedent to strive for more than individuals need (Hickel, 2020). Society is however trapped into the growth paradigm. As the economy is organised today, society degrades in times of slowing growth or recession (Hickel, 2020). ‘Post-growth’ responses vary from amending existing economic structures to better account for environmental impact (Jackson, 2011; Rockstrom et al, 2009; Stern, 2006; Van den Bergh, 2006), carefully managing a ‘steady state’ at which economic throughput is stabilised (Daly, 1992, Meadows et al, 1974), or an entire structural transformation of the economy (Hickel, 2020; Latouche, 2009; Saito, 2020).
An economy separate from its material base
Epistemology is at the heart of this debate to whether growth and the maintenance of the environment can co-exist. Orthodox economists assume a market logic that stands above the material world and thus often underplays it. This places them in contention with ecologists and practitioners of ecological economics, who emphasise the material and ecological base of the economy (Daly, 1992; Foster, 2000; Martinez-Alier, 2010; Taylor, 2015). Quoting ecological anthropologist Tim Ingold, something “must be wrong somewhere, if the only way to understand our own creative involvement in the world is by taking ourselves out of it.” (Ingold, 2000, pp.173).
The problem arises that if the standard set of economic tools neglects the limitations of the planet’s material base and places too much trust in human capability to decouple from it, how do we analyse and ultimately respond to overconsumption and excessive degradation? Some approaches have developed, generally stemming from ecological research. Wackernagel and Rees’s (1996) ‘ecological footprint’ model attempts to calculate individual and national resource consumption in terms of the productive land required. This framework explicitly ties production and sustainable levels of human activity to land availability. While successfully reattaching the economy to the environment, it is a limiting model: it assumes that the area required for sustainable land use will not change (due to technology, population or climate change) and the scope of a sustainable economy is limited only to what is connected directly to land use.
The ‘planetary boundaries’ framework attempts to specify a space deemed safe for humanity to operate within as the Holocene enters the Anthropocene (Steffen et al, 2015). It attempts to quantify the capacity of the planet to support current human activity and the human pressure on the planet, highlighting how the planet’s subsystems interrelate, and how dramatic change in one factor may have catastrophic effects on other factors and the planet as whole. This was later developed into the ‘earth systems boundaries’ (ESB) framework (Rockstrom et al, 2023). It calculates that seven of eight boundaries have been surpassed. The relatively optimistic tone of the former research has been replaced with a warning that “nothing less than a just global transformation across all ESBs is required to ensure human well-being” (pp.8).
Georgescu-Roegen (1971) explored the concept of entropy in relation to economics, creating the field of ‘bio-economics’ and heavily influencing the development of degrowth and steady state economics. ‘The entropy law and the economic process’ argues that the human economy is subject to the forces of entropy, to which the entire physical world follows. He presents production in terms of a flow-fund model, which differentiates between material flows in production and renewable funds (such as labour or land) through which the flows are processed. As flows are processed and consumed, they transform from low to high entropy flows. The implication of this is that at every stage of production a portion of flows degrade, meaning that useable flows are in constant decline.
Steady state economics and degrowth
Georgescu-Roegen’s (1971) work connecting economics to entropy played a significant role in the development of steady-state economics (SSE). Daly (1992) developed his SSE model as a modification of Georgescu-Roegen’s concept, instead thinking in terms of ‘stock’ and ‘throughput’, where stocks are comparable with Georgescu-Roegen’s ‘funds’ and ‘throughput’ with ‘flows’. The aim of a SSE is to maintain the level of stocks while limiting throughput to the lowest possible level, in doing so minimising pollution and waste.
Figure 1: Daly’s SSE model equation

Source: (Daly, 1992)
Above is Daly’s equation explaining the relationship between service, stock and throughput. Stock in this equation cancels itself out leaving service/throughput as the key dynamic in the framework. Ratio 2 and ratio 3 represent ‘efficiencies’, in which service is to be maximised and throughput minimised, the intention being to limit resource usage. This system must however be an open rather than isolated one, otherwise the availability of resources inevitably depletes.
An important development here is a recognition of the inputs to maintaining stocks. While food production itself is renewable, the intensity of agriculture is not. It has become highly dependent on fossil fuels, chemicals and fertilizers which are not renewable and whose production can be damaging of the environment. An implication which Daly fails to highlight therefore is that stocks are not as renewable as Georgescu-Roegen implied.
Daly recognises specific elements of society that in the SSE model would be considered stocks do not hold constant and indeed should not. Culture, knowledge, ethics and genetics change over time. This means that the composition of stock also changes – the steady state economy thus must develop but not grow – if growth is to mean a quantitative change. There is however space for growth in a non-material sense, as the SSE is a physical concept: “Ifsomething is nonphysical, then perhaps it can grow forever” (Daly,1992). Daly therefore does not rule out the orthodox economics argument that growth should gradually shift in favour of services over industry.
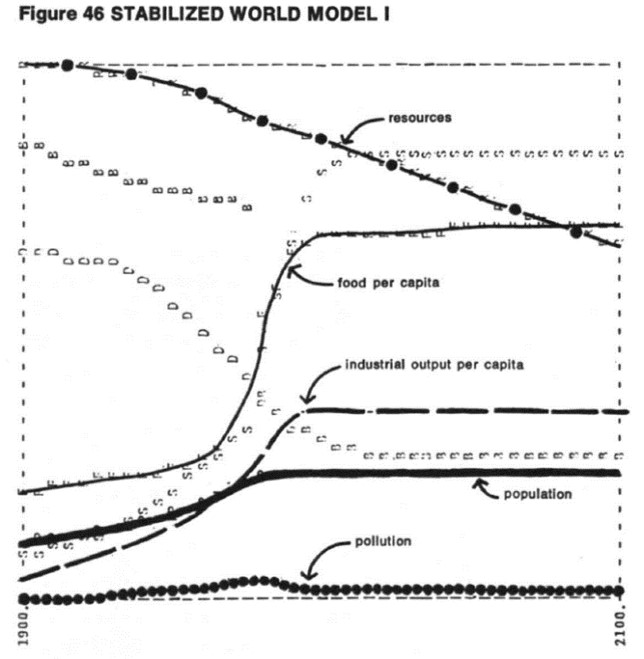
While Daly (1992) has produced a robust SSE model, Kerschner (2010) identifies early steady-state concepts in Schumpeter’s (1911) ‘Krieslauf’ and Keynes’ (1936) ‘quasi-stationary community’. The Limits to Growth is also a clear forerunner to the SSE, adjusting World3 to model firstly a stabilized global population, and deeming that insufficient to avoid sudden industrial and population collapse, a stabilized world model in which industrial output is also constrained.
Figure 2: World3 model with stabilised population
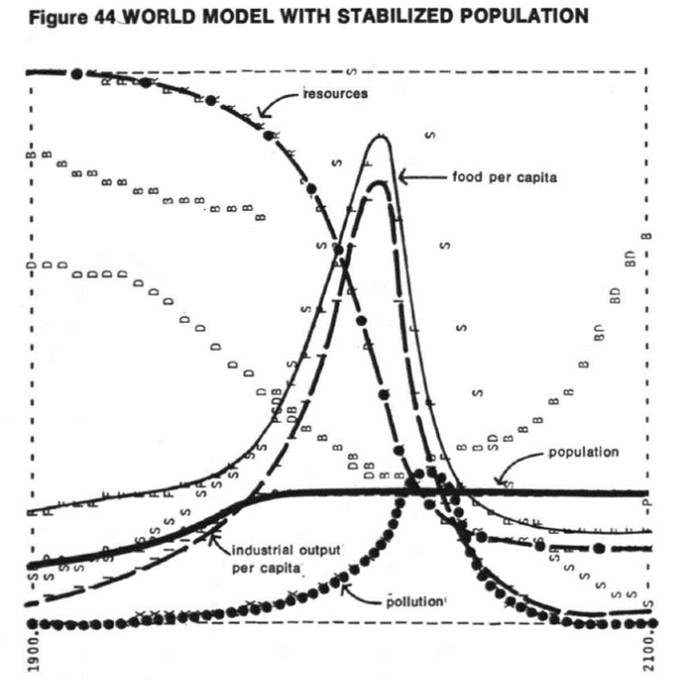
Figure 3: Stabilised World3 model
Source: (Meadows et al, 1974)
The predicted collapse has not occurred despite significant population and industrial growth, giving credence to sceptics of the research, and a degree of relief for proponents who must conclude that the modelling produced conservative predictions. An explanation for this could be that technological advance has successfully mitigated human degradation of the environment. While fashionable amongst critics of orthodox economics to write-off the technological fix (Taylor, 2015) any method that contributes to slowing environmental collapse should be commended. However, the stark warning that exists in these models is how difficult it will be to reach an economy which ceases to degrade the environment, and the grave risks of uncontrolled material growth.
Proponents of degrowth argue the SSE does not go far enough (Latouche, 2009; Kallis, 2011). Applying the ‘bioproductive space’ measure outlined in Our Ecological Footprint Latouche (2009) argues the planet is running an ecological debt. While the roots of this issue began in the 18th century it only recently became a deficit. In 1960, humans utilised 70% of regenerative biosphere, compared to 120% in 1999. Kallis (2011) posits that growth is not sustainable with the apparent resource and emission limits of the planet. Assuming that degrowth is thus inevitable, he questions how it can be socially sustainable. Kerschner (2010) contends that that degrowth and SSE are complementary to each other, highlighting as many other researchers have that degrowth is not a goal in itself (Daly, 1992; Meadows et al, 1974; O’Niell, 2012).
Society and demographics
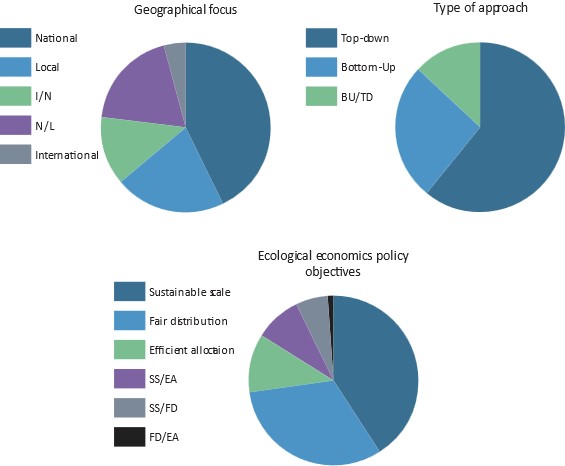
Cosme et al (2017) produced a grounded theory analysis coding main foci of the existing degrowth literature. The above charts represent the coding criteria in Cosme’s (et al, 2017) research, which divided the components of the degrowth literature into geographical focus, structure of approach to degrowth (top-down or bottom-up), and the ecological economics policy objectives integrated into each approach. The analysis surprisingly found that the literature centred more on social equity than on environmental sustainability.
Figure 4: Cosme (2017): focus points of SSE and degrowth literature
Source: (Cosme et al, 2017)
This literature review, focussed on the most influential research on degrowth and the SSE, found the opposite. Whether this is a result of the coding methodology in Cosme et al’s (2017) research or bias within which articles are more likely to be cited, social equity is an essential consideration of the debate. Degrowth is after all an alternative economic paradigm, and thus society and social structures should be central to the debate.
Population control is a taboo topic in the social sciences. The topic holds however a critical role in the degrowth and SSE debate. The Limits to Growth highlighted the dramatic impact that population growth can have on the sustainability of the economy and environment (Meadows, 1974). Allow population to rise too far and capacity to sustain it collapses. This is also implicit in Our Ecological Footprint, as the higher the population, the less biocapacity per capita (Wackernagel, 1996).
In Daly’s (1992) SSE model, human population is one of the primary stocks of the economy, which must be maintained at a stable level. Alongside ‘artifacts’, or physical wealth these collectively account to the capital stock of the system. The implication here is the essential link between population and consumption growth – each propels the other. In the case that consumption per capita were to stabilise, with continued population growth, so would consumption.
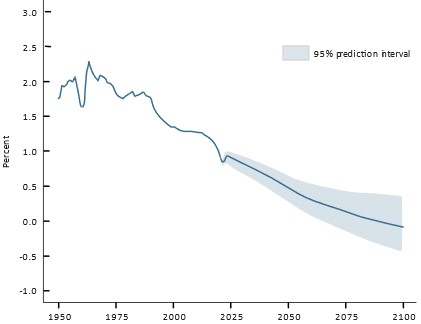
It is true that population control comes with deep ethical dilemmas, but avoiding the discussion because it is difficult is no suitable answer. If The Limits to growth (1974) was correct to suggest crossing ‘peak population’ would result in a dramatic population drop, then continued growth is also ethically problematic for population. The world population is expected to have nearly stopped growing before the turn of the century, (UN, 2022) offering the possibility of non-intervention in population, but the question remains whether another 50 years is too far away.
Figure 5: world population growth predictions
Source: (UN, 2022)
Latouche (2009) believes that targeting population is a “lazy solution”, arguing uneven power distributions stem from population control. Contrary to the fears of Malthus, it is not population growth outstripping economic growth, but increasing economic affluence outstripping population growth that fuels unsustainable consumption (Jackson, 2011). In the 200 years it took for the world population to increase sixfold, global production and consumption multiplied in scale by several hundred times (Latouche, 2009). Latouche fails however to acknowledge how population acts as a multiplier to economic growth. While evidently not growing at the same rate, it contributes to its unsustainability.
Technological progress appears to have overcome a ‘Malthusian apocalypse’, but in reality it has merely delayed it through an “energetic subsidy” (Kerschner, 2010). Modern agricultural techniques have become dependent on extremely high energy inputs, including fossil fuels, which are now being rapidly depleted. Even given increases in efficiency, these resources will ultimately come to an end.
It is evident that as population size and the level of development varies greatly globally, assuming an equitable degrowth transition the scale at which each country would need to transform varies too. In principle one would expect greater degrowth in the most developed nations of the world (Martinez-Alier, 2010; Escobar, 2015). As social inequalities have expanded globally, so has social responsibility. This is politically difficult as countries in the global north holding the most economic and political influence – and thus the least willing to sacrifice economic wealth – are those who would need to adjust the most.
Believing that developed countries must shrink in GDP terms does not mean that less developed countries should pursue a GDP growth logic to ‘catch up’. If degrowth is to critique a logic of growth, endorsing it for some countries while rejecting it for others is contradictory (Escobar, 2015). It is however appealing logic. The material burden of continued growth is arguably more visible in global south countries, where extractive activities directly damaging of the environment are more widespread (Arboleda, 2020; Girvan, 2014; Gudynas, 2018). No wonder then, that movements such as Buen Vivir (Gudynas, 2011) have evolved in the global south in opposition to globalist development. Saito (2020) argues that climate justice of the global south is integral for realising an economic system which is also ecologically sustainable, orienting the economy more towards the community and need than production for profit.
Institutions of a degrowth economy
One of the common critiques against degrowth is its lack of strong theoretical framework. (Herath, 2016; Kerschner, 2010; Van den Bergh, 2011). It is true that it lacks the theoretical models of the SSE literature (Meadows et al, 1974; Daly, 1992), but the critique misses the value in vision. Much of the literature states that degrowth is predominantly a political banner (Kallis, 2011; Latouche, 2009; Research & Degrowth, 2010). The implication is that policy suggestions common to the degrowth literature are unlikely to be adopted in a market economy and thus suggest the need for systemic transformation (Kallis, 2011).
While a theoretical framework is lacking, policy vision is not. Some policy suggestions specifically target environmental damage, such as eco-taxes on transport (Latouche, 2009), environmental damage (Kallis, 2011), consumption (Kallis, 2011), and carbon (Jackson, 2011), or instigating constraints on environmentally damaging industries (Hickel, 2020). Closely related are resource use policies, including cutting energy waste (Latouche, 2009) and caps on resource use (Jackson, 2011; Meadows, 1974). Policies targeting the organisation of work include shorter working hours (Kallis, 2010; Latouche, 2009; Saito, 2020), the re-localisation of production (Latouche, 2009; Saito, 2020). Constraint (Hickel, 2020) and penalties on, (Latouche, 2009) or abolition of (Saito, 2020) advertising are also proposed. Socioeconomic policies such as the redistribution of excessive income from the wealthiest (Hickel, 2020) and a revival of valuing of social institutions as part of the economy, such as friendship (Latouche, 2009; Saito, 2020) also exist.
Degrowth can refer to institutional rather than entirely transformational change. (Jackson, 2011) The risk of dismantling every existing institution is large, as is the work of completely rebuilding. Jackson (2011) suggests instead an ‘ecological macro-economics’, aiming to “understand the behaviour of economies when they are subject to strict emission and resource use limits” (pp.176). This vision of a market-led degrowth would require: a transition to a predominantly service based economy; investment into ecological assets, and reduced working time policies to stabilise the economy – low productivity as an intentional constraint on growth.
The degrowth debate has seen little light in East Asia, but Saito Kohei’s book Capitalism in the Anthropocene (2020) has found a large audience in Japan. Saito (2020) has contributed two significant elements to the degrowth literature. Firstly, he formulated the concept of ‘degrowth communism’, a version of degrowth oriented towards a transformation of society organised at the grassroots, living ecologically with workers owning their own means of production. Secondly, and critically to this paper, he has raised the question of alternative economic organisation to a new audience in East Asia.
3. Methodology
This study asks: could a steady state economy function within the existing global economic system? To answer this question, this paper uses Japan as a case study as it is arguably tending towards steady state conditions, as theorized in Daly’s (1992) steady state model.
Japan is on track to become one of the first major developed countries where national population flatlines (World Bank, N.Da). Economic growth is likewise slowing to a standstill, paling in comparison to regional neighbours and the global average (World Bank, N.Db). Where the pervading economic logic would expect such conditions to destabilise an economy, Japan has seemingly remained stable (MUFG, 2021; The Economist, 2021; WEF, 2023; Woo, 2023). This makes Japan a suitable case study to explore whether SSE conditions could realistically be sustained, and in turn evaluate the utility of the SSE model in a real case scenario.
This paper assumes that pursuing an alternative economic model to the growth paradigm is a valuable exercise. As explored previously, the growth economy risks depleting the planet’s finite resources, and while technological advance may mitigate this process it is only temporary. The necessity to entertain the possibility of economic transformation has become increasingly clear as more ecological boundaries have been overstepped (IPCC, 2018; Rockstrom, 2023).
The aim of this research is therefore to explore whether the SSE could be an alternative, an important exercise as governments increasingly need to tackle the root of climate change. Daly’s (1992) SSE model is used as a theoretical framework to analyse Japan’s economy in terms of ‘stocks’ and ‘throughput’. As explained previously, stocks in the SSE model are components of the economy which should be kept at a constant level (population and capital wealth) Throughput roughly corresponds to production and consumption. Flows must be kept at the minimum possible level, aiming to sustain rather than grow the economy.
A convergence triangulation method (Creswell, 2014) is used, collecting appropriate socio-economic indicator data for each fundamental stock and throughput from the Statistics Bureau of Japan, as well as government reports exploring the effects and responses to trends in these indicators. The aim of this approach is to map key stock and flow indicators to a real-life case and corroborate social impact in a way that avoids relying on indicators aligned to a growth paradigm.
It is essential to highlight that Japan is not actively pursuing an SSE or degrowth policy but is naturally falling towards it as demographics and productivity change. This means that Japan is not following an SSE paradigm explicitly to address climate change. The economy remains organised towards growth and society is thus oriented towards the ideals of growth. This represents a significant challenge to the following analysis, as there is no policy incentive in place for Japanese businesses or individuals to pursue the sustainable consumption ideal of the SSE. Indeed the opposite remains, growth logic being one of maximising economic gains.
This paper thus takes the stance that as growth approaches 0%, consumption is constrained in such a way that steady state conditions are closely replicated in monetary terms, if not in societal mindset. As a contentious issue within the methodology, this shortfall will be tackled within the following analysis.
4. Analysis – Stocks
Stocks are, according to Daly, the factors of the economy which must be held at constant levels – assets which ideally yield a high degree of services while requiring only limited throughput to maintain. This includes “capital goods, the total inventory of consumer goods, and the population of human bodies” (Daly, 1992, pp.16). Stocks do however depreciate, meaning that stocks themselves must be replenished – in the SSE model via controlled throughput. It is only possible to slow down resource depletion, not halt it.
In this section I am not concerned with how large stocks are, but whether they remain stable under current conditions and are thus sustainable at a steady state. In the process of addressing this question, this paper elucidates issues with Daly’s concept of stocks, namely the challenges in consistently differentiating them from other factors of the economy.
This section differentiates between three forms of stock – population, capital, and environmental stocks. Stocks are divided in this way according to Daly’s (1992) description of stocks provided above. The category of ‘environmental stocks’ is added to account for Daly’s understanding that all stocks originate as ‘ecosystem stocks’ (pp.78).
Why limit stocks?
Attempting to consider which indicators aptly measure the scale of unchanging assets within an economy and discovering how few are adequate for the job highlights starkly how focussed the economy is on high throughput, the very opposite aim of an SSE. Daly (1992) argues that services stem from stocks, not flows. Services are gained as stocks increase, but past a threshold the cost on natural resources is too high. That many stocks such as gas are short-lived creates an illusion that services are the results of flows. “We cannot ride to town on the production flow of autos on the assembly line nor on the depreciation flow of autos decaying in the junkyard but only in an existing auto that is a member of the current stock” (Daly, 1992).
Daly (1992) does not elaborate clearly what the main components of stocks are but does identify their root in ‘ecosystem stocks’ (pp.78). As was starkly predicted in the World3 model (Meadows et al, 1974), a breakdown in natural resources can quickly lead to collapse in the human society built upon them. In a world of global value chains, it is implausible to impute depletion of national environmental stocks to the overall environmental cost of a nation’s economy. In the case that a country is not highly import dependent it can be assumed that there is a relatively strong correlation between national economic throughput and its impact on national ecology – a point which is explored below.
Population stocks
The implicit suggestion that population control is a necessary mechanism for an SSE to operate is a deeply controversial moral dilemma. If an SSE model were pursued globally, it is an issue that must be faced but for the purposes of this study an in-depth discussion of this dilemma can be omitted, as Japan’s population is no longer growing.
Although discussion of the moral implications of managing a steady population can be avoided here, considering it from a structural perspective is valuable. As explored in The Limits to Growth (Meadows et al, 1974), the planet can support an increasing population size only so far before the food production and industry to support it fails. Yet the modern economy is designed in such a way that expects and needs population growth (Peterson, 2017; Piketty, 2015). It is thus important to explore whether a steady population creates its own pressure points on society and economy.
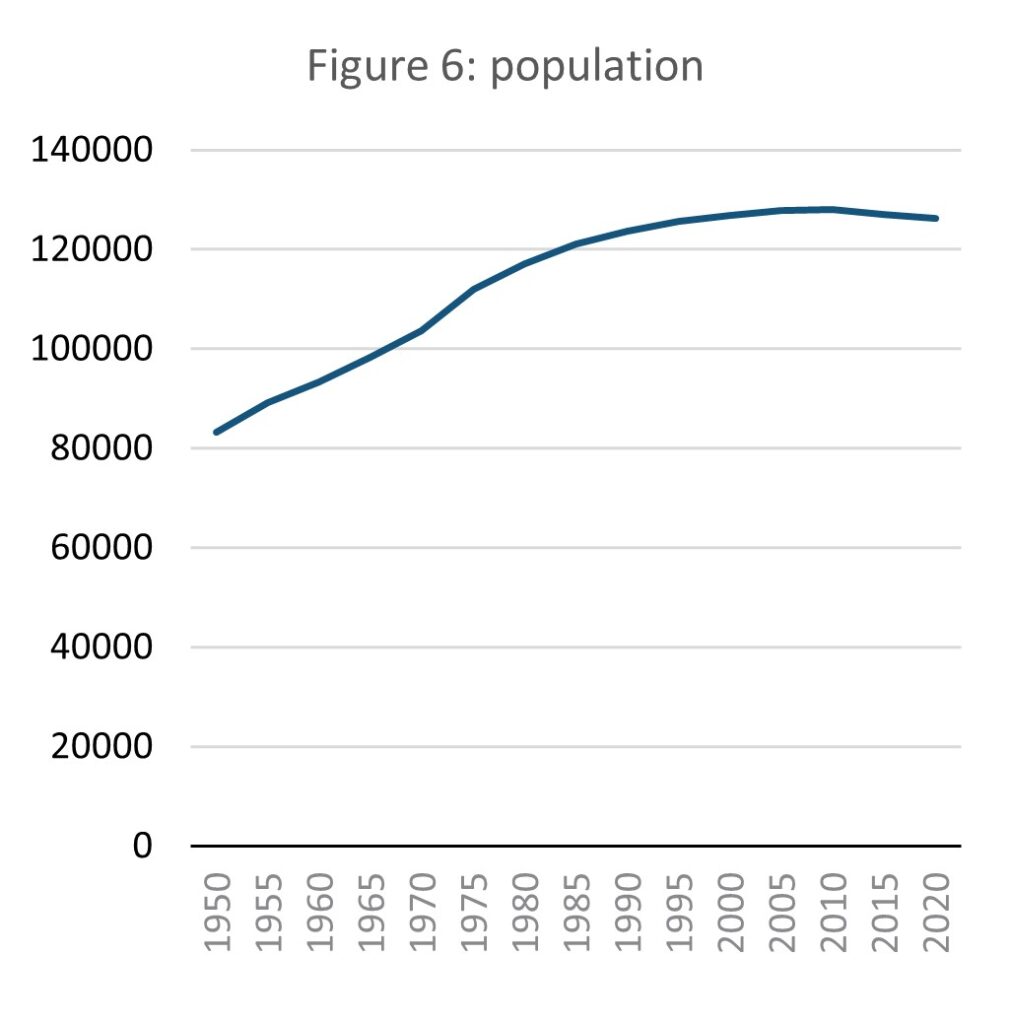
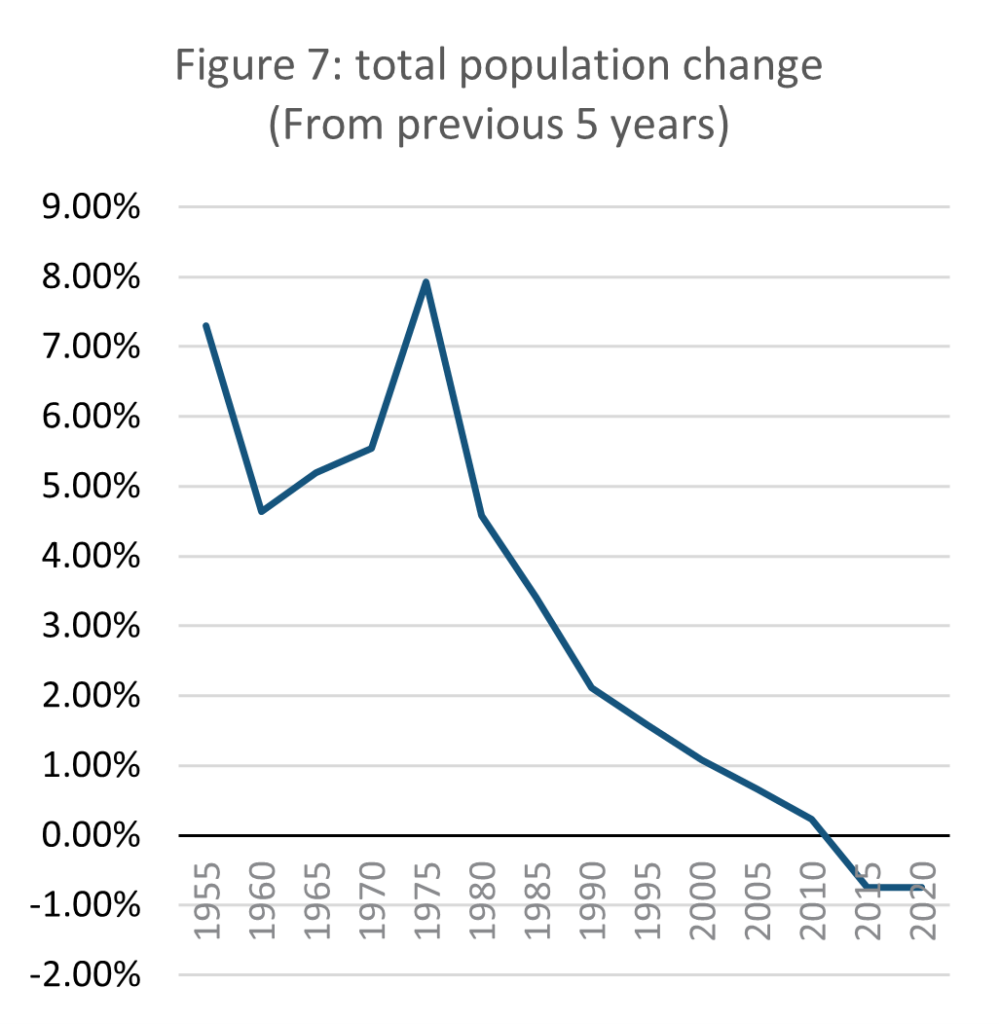
Source: E-stat – Statistics Bureau of Japan (author’s calculations)
Japan’s population growth has been slowing since the 1970s, and its overall population began to fall slightly in the last decade. Between 2010 and 2020 the population fell by nearly 2 million, or 1.6%. The Japanese Ministry of Health, Labour and Welfare (MHLW, N.Da) predicts the national population has peaked and will fall for the foreseeable future, by as much as half by 2100.
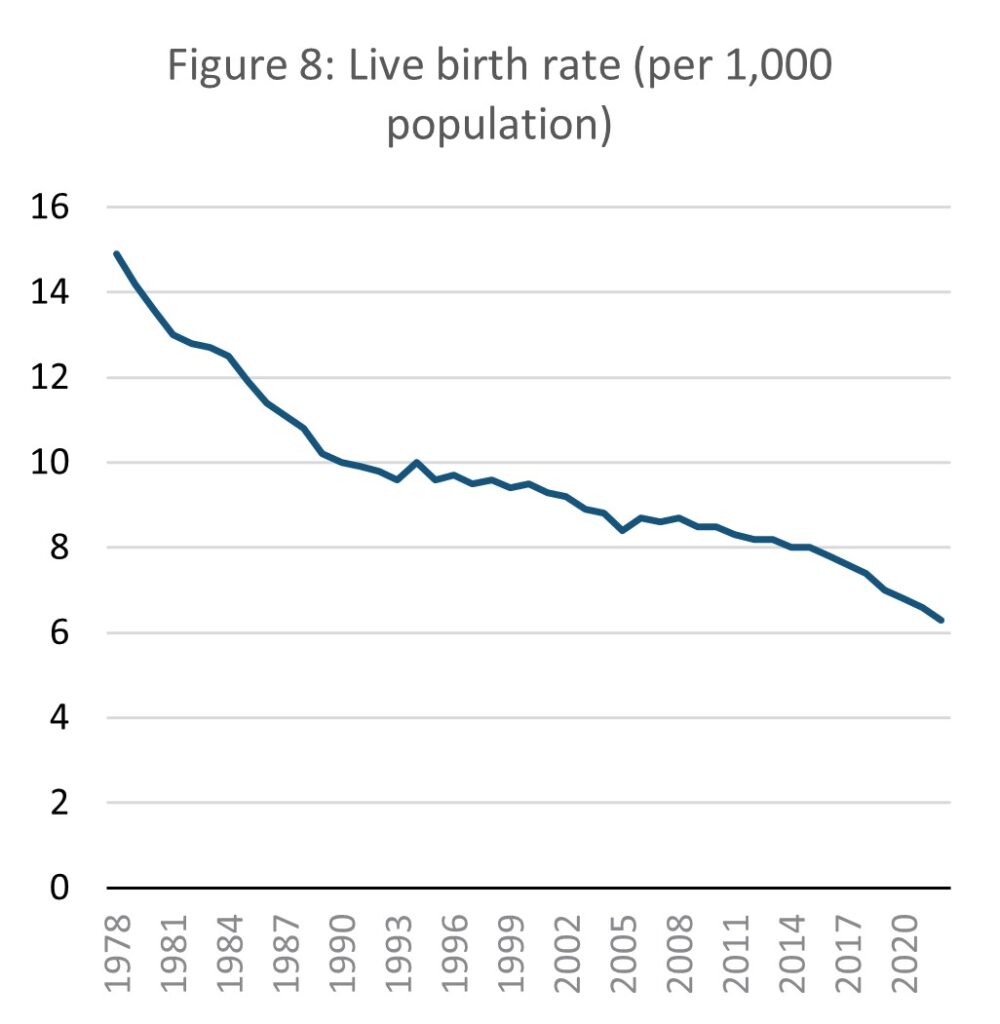
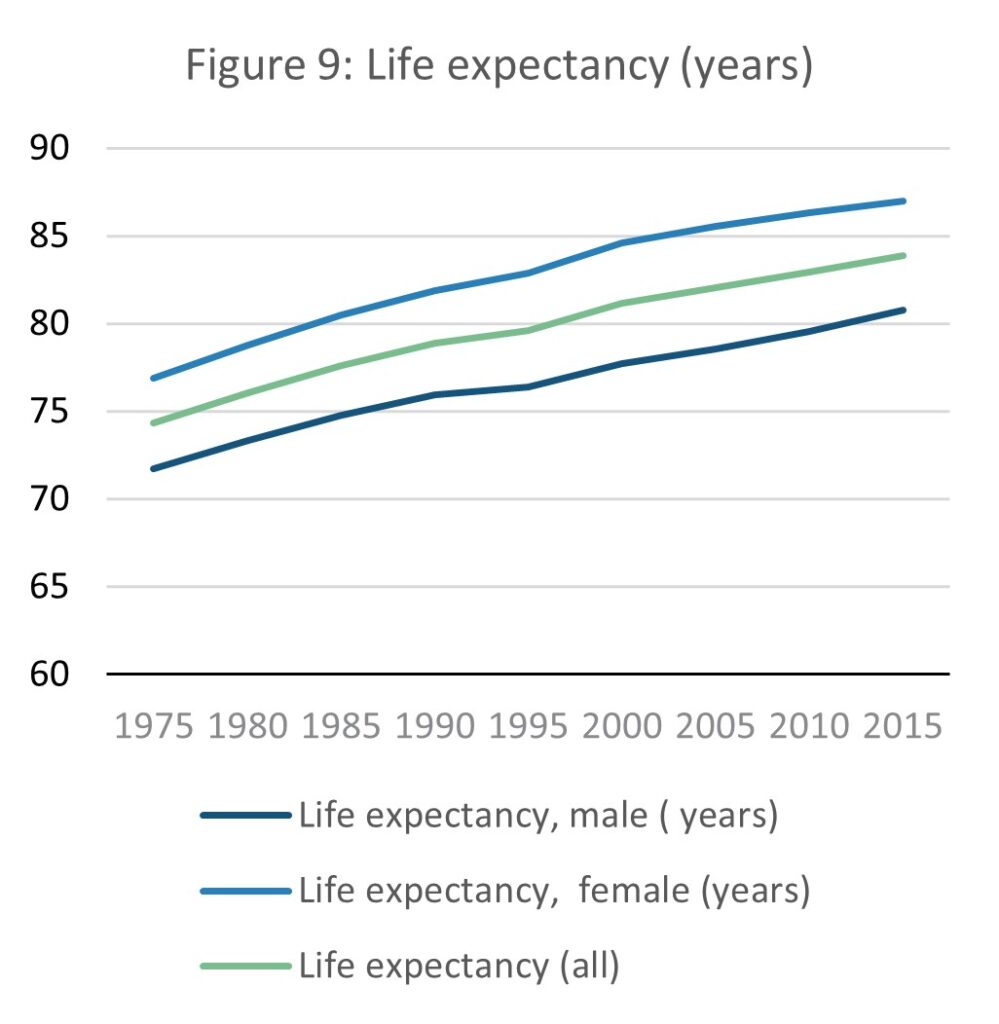
Source: E-stat – Statistics Bureau of Japan (author’s calculations)
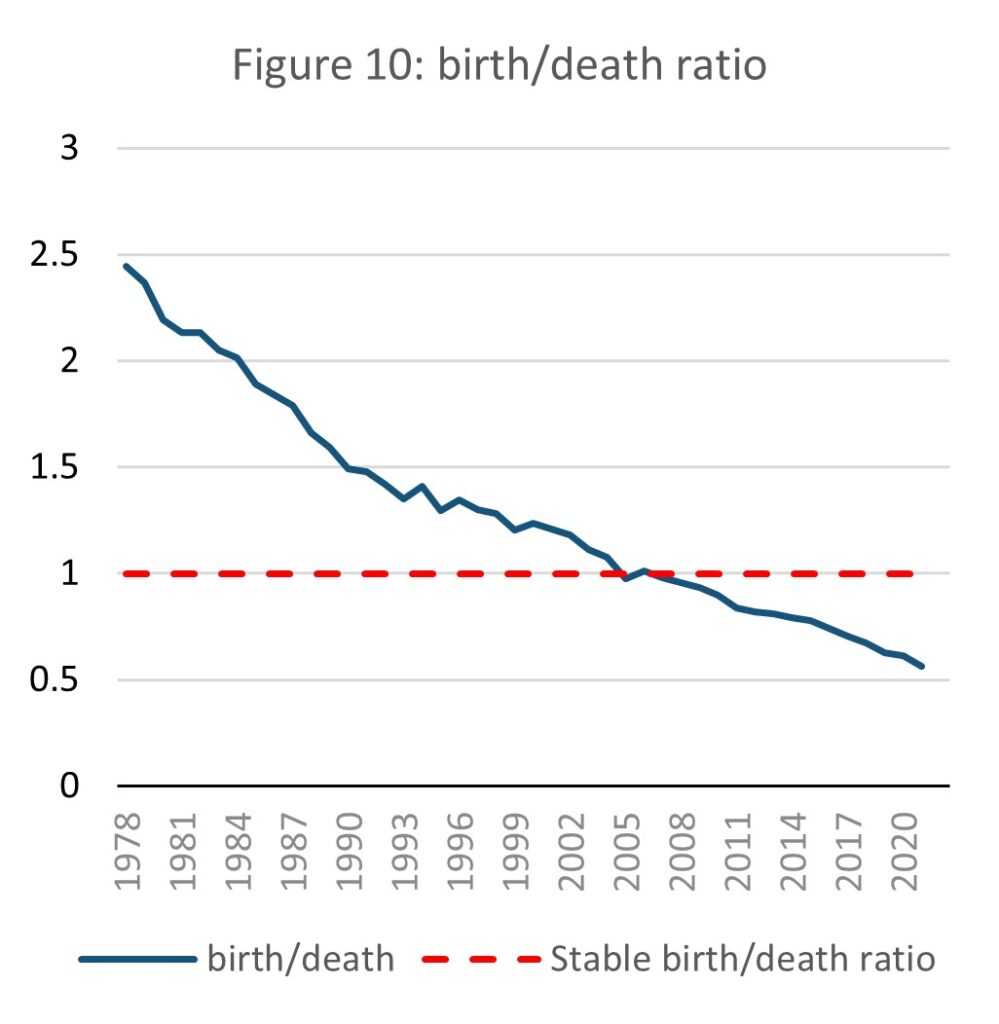
Population growth data alone says little about the causes of population change, and therefore fails to explain why growth is close to 0%. Fertility and mortality data gives better insight into the long-term prospects of the population. The birth rate in Japan has declined consistently for the entire length of national records, between 1987 and 2020 falling by 56%.
Life expectancy has meanwhile increased over the same time period by 9.6 years from 74.3 to 83.9 years. While increased life expectancy may be positive for individuals it can be a pressure on age demographic distribution. As the birth rate falls and life expectancy increases, national age demographics become increasingly skewed towards the elderly. As the proportion of births to deaths has rapidly fallen, national annual deaths have outstripped births since 2005, to the point that in 2020 there were approximately half as many births as deaths in Japan.
National forecasts expect the population to continue aging, and by 2070, 29% of the population will be over 65. The population under 14 will meanwhile decline slightly from 12% in 2020 to 9% in 2070 (MHLW, N.Da).
UNDESA predicts that the world population will peak at around 11 billion in 2100. Most of this growth will occur in low and low-middle income countries. While population growth is linked with economic growth, it is a barrier to sustainable development (UNDESA, 2022). Slow population growth thus should in principle ease Japan’s path to a more sustainable economy, but the growth limitations stemming from that is likely to make Japan less competitive against high economic and population growth countries. This is a problem any country pursuing an SSE model would face if other countries globally maintained a growth-oriented economy.
Workforce
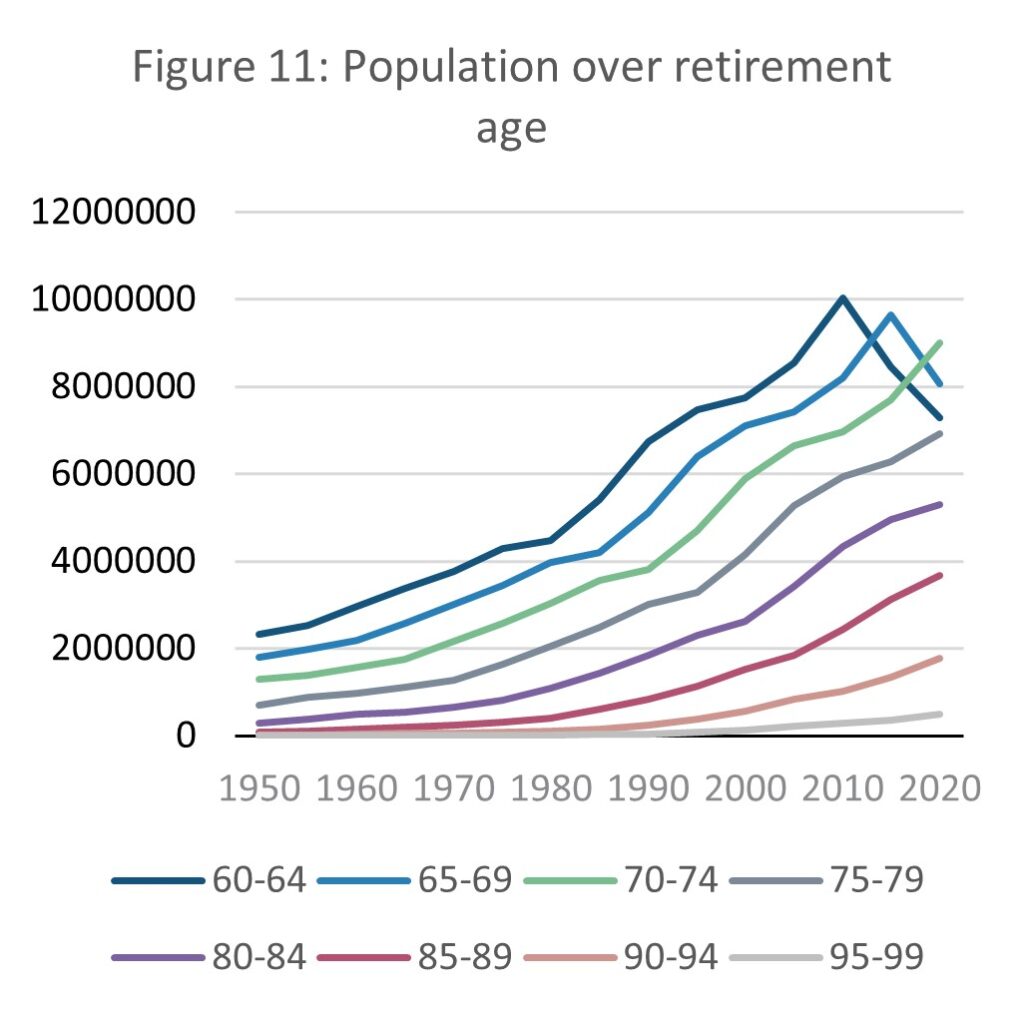
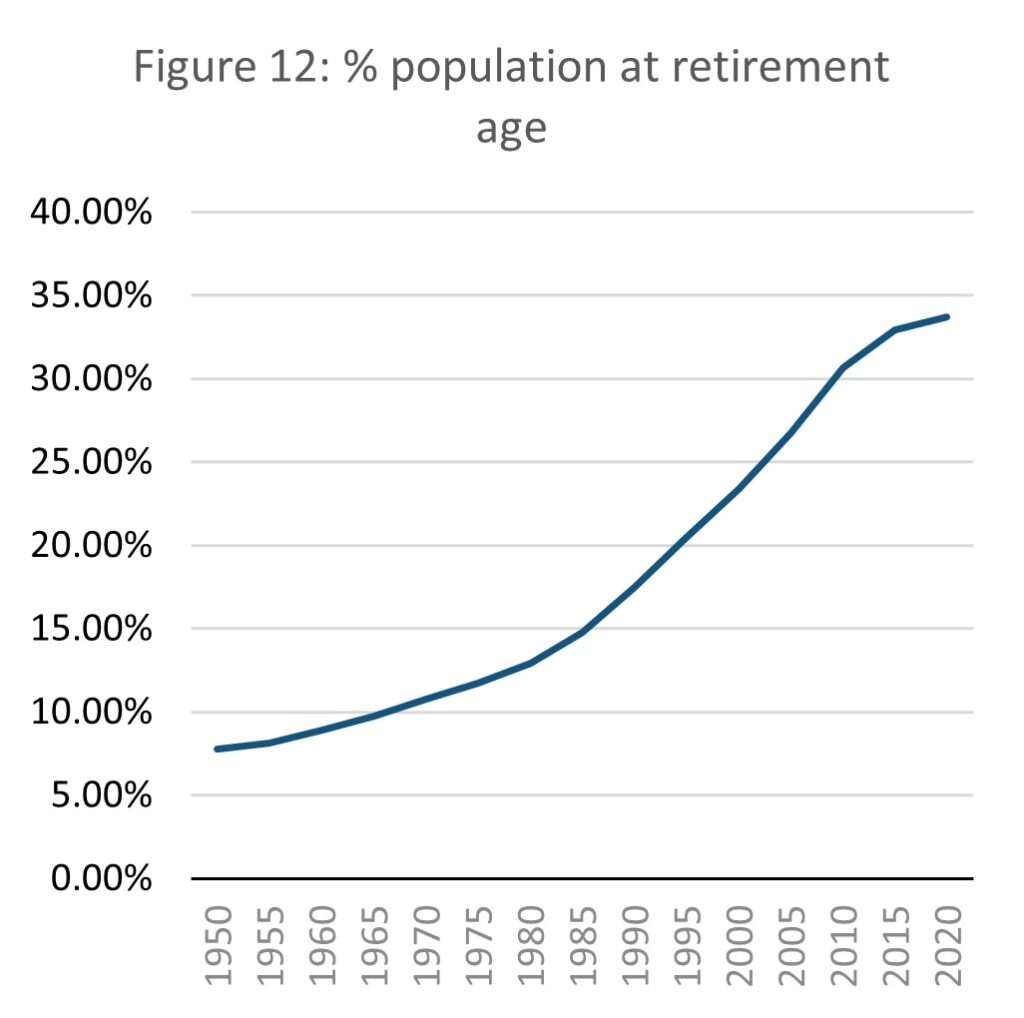
The shift in demographics towards retirees is a key issue for Japan’s workforce and by extension its economy. While the overall population is relatively steady, the workforce is shrinking and the number of people dependent on social support is rising.
Source: E-stat – Statistics Bureau of Japan (author’s calculations)
Since 1950, the proportion of the population at retirement age (using the normal national retirement age of 60 (MHLW. N.Db.)). was 7.8%. This has risen since to 33.7% in 2020, over three times higher. The pace of this increase is slowing as of 2010 but is still rising. While most retirees will not contribute to the economy through working, the higher the age of a retiree, the more support they are likely to need from the state and family. As national demographics skew further towards the elderly, an increasing proportion of the elderly population are living into their 80s and beyond. While this is a testament to the standard of wellbeing in Japan, it is a pressure on the economy as the proportion of productive population falls and those who no longer work require even more resources than in the past.
Source: E-stat – Statistics Bureau of Japan (author’s calculations)
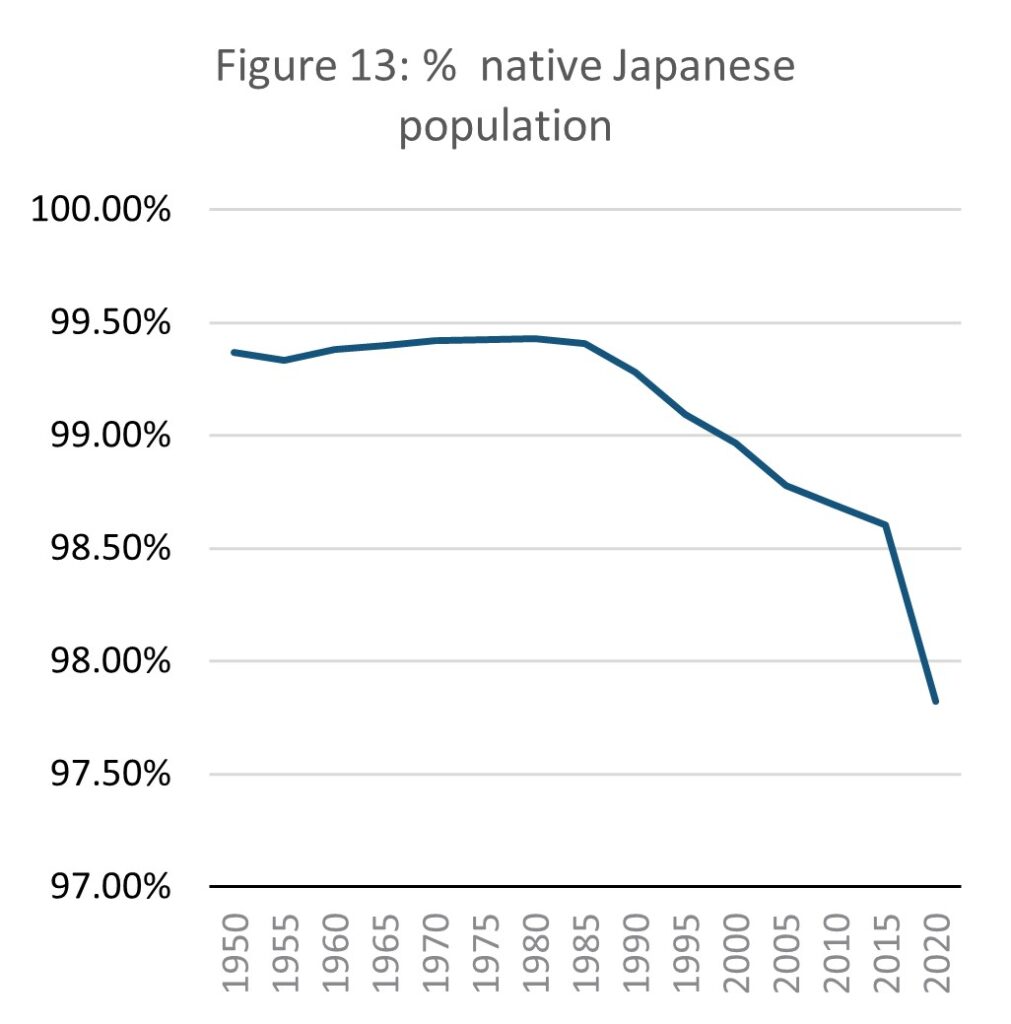
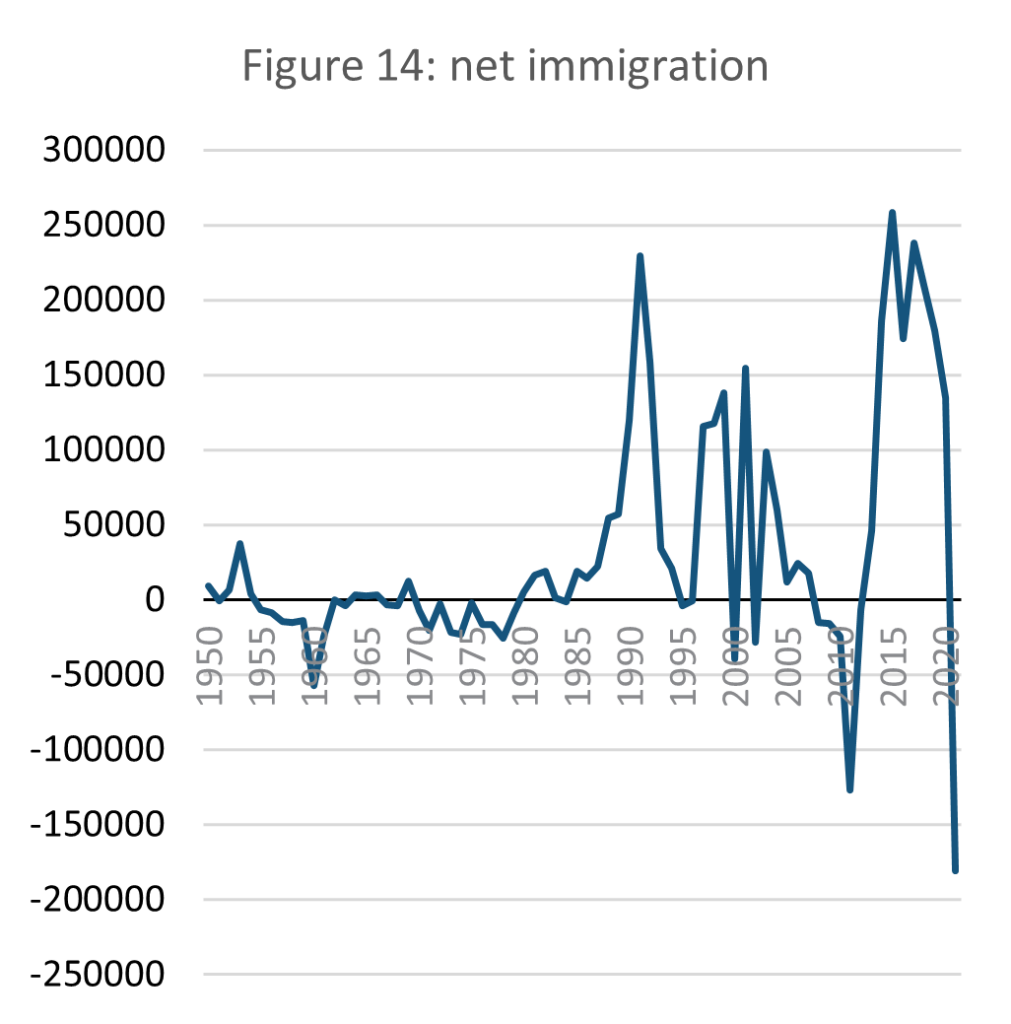
One possible solution for balancing Japan’s demographics is encouraging immigration. Japan’s population is almost homogenous, but a small non-Japanese population has developed since the 1980s. The pace at which non-Japanese citizen population has grown increased considerably from 2015. The population remains however widely homogenous with a Japanese citizen population of 97.8%. This coincides with discussions in 2016 within Japan’s governing party, the LDP, acknowledging the need to soften the country’s stance on migration to counter slowing population growth. (Kimura, 2022).
Immigration is however a taboo subject and a pushback especially against unskilled workers has existed since the 1960s (Kimura, 2022). There are concerns that while encouraging immigration may be necessary to offset a shrinking workforce, an influx of foreign workers would transform Japanese society detrimentally (NRI, 2023; Se, 2018). This concern has heightened since the 2015 European migrant crisis (Nikkei, 2021).
Population stocks are not as steady as they appear at first glance, as population is now on a declining trajectory. This weakens the value of using Japan as a case study in SSE dynamics, but the demographic pressure on the workforce and social security that emerged over Japan’s period of flatlined population reveals that maintaining steady population can lead to economic instability.
Capital stocks
Daly (1992) suggests net capital formation as an indicator for capital stocks but this paper deems his approach problematic. Generally used as a measure of the potential for growth, the SSE attempts to avoid growth altogether. Net capital formation alone is a measure concerned with maximising assets rather than optimising them. This leads to the need for an ‘optimum stock’. Stocks reach their optimum level when total service from a given stock is at a maximum. To find the optimum between net capital accumulation and services, we must have a means of A. separating services and throughput more clearly (the difficulty in separating services and throughput is explained later in the paper), and B. aggregating all services. This is not yet a possibility.
There is therefore little value in using net capital formation to measure capital stocks in this paper. without an existing method for clearly separating services from throughput, it becomes impossible to calculate a relationship between net capital accumulation and the services stemming from it.
Finding an existing alternative is challenging as indicators tend to be organised around flows not assets. There are multiple stock factors to take into account, with few established indicators to work with. The closest available is the concept of ‘wealth’, which attempts to track the amount of assets within an economy rather than production and consumption flows (IISD, 2021).
A series of wealth indicators have been developed. The World Bankdivides wealth into natural, human, produced, and financial capital (World Bank, 2021). This is aggregated into a single index. The OECD (2020) takes a different approach, measuring wealth in terms economy, natural, human and social capital, keeping each indicator separate. Other approaches to measuring wealth have been promoted by the World Economic Forum (2017) and the Bennet Institute (2020).
These indicators, as much as they were designed to better understand wealth, suffer from the same shortfall as net capital formation as suitable indicators of capital stock. The OECD’s ‘hows life?’ report (2020) offers the most valuable approach as it omits growth and remains disaggregated allowing for analysis between factors of wealth, but it also offers no way to separate stocks from throughput. The OECD defines household wealth as “the difference between all financial and non-financial assets (such as dwellings, land, currency and deposits, shares and equity) owned by households and all their financial liabilities (such as mortgages and consumer loans)” (OECD, 2020). This is not an ideal measure for this study as stocks (land and dwellings) are merged with assets that in some circumstances should be considered throughput (currency, shares, loans).
For an SSE model to be viable in practice, an effective method for understanding and measuring capital stocks is necessary. Daly’s own preference of net capital formation is not sufficient, and neither are the emerging wealth indicators developed in recent years.
Natural stocks
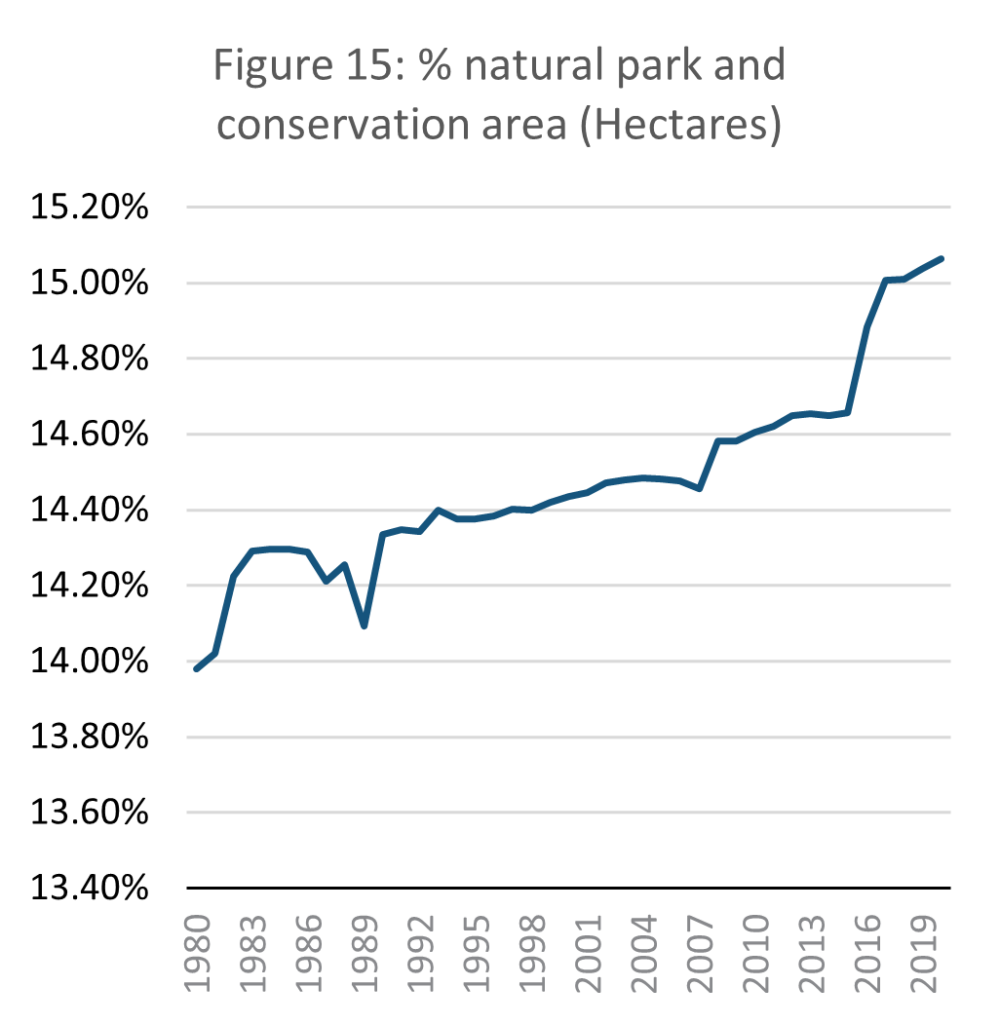
The SSE model developed in response to the burden that uncontrolled growth can exert on the environment and the total natural resources available on the planet. Natural resource and land use is therefore treated here as the fundamental stock on which all others rest. This is explored from two angles: uncultivated land, and food sustainability, the former as a measure of the degree of ecological degradation nationally, and the latter as an indicator of whether current land is able to produce sufficient food to maintain the population. This section therefore analyses to what extent Japan has managed to maintain its environment and food supply as population and economic growth has slowed and to what extent we can understand this from an SSE perspective.
Source: E-stat – Statistics Bureau of Japan (author’s calculations)
The proportion of land in Japan designated as a natural park or a conservation area increased slightly by 1.1% between 1980 and 2020. This means that the amount of protected land has remained relatively steady, tending towards a slight improvement over time. Focussing on natural parks is not fully representative of Japan’s undeveloped land but gives indication of how valued the preservation of natural space and the ecosystem is.
Natural parks were established in Japan as a way of simultaneously protecting the environment and providing a space for recreation (Kankyo, 2017). Article 1 of the 1957 natural Park Law states that national parks are designated both to protect natural space, and to provide a recreational and educational space for citizens (E-gov, 1957). Natural park designation does not however guarantee ecological protection. Only areas within parks designated as ‘special zones’ (特別地域) receive protection, in which case the following activities are banned: construction and resource extraction; land cultivation; harming and capturing animals, and discharging wastewater within a kilometre of the park (E-gov, 1957).
Source: E-stat – Statistics Bureau of Japan (author’s calculations)
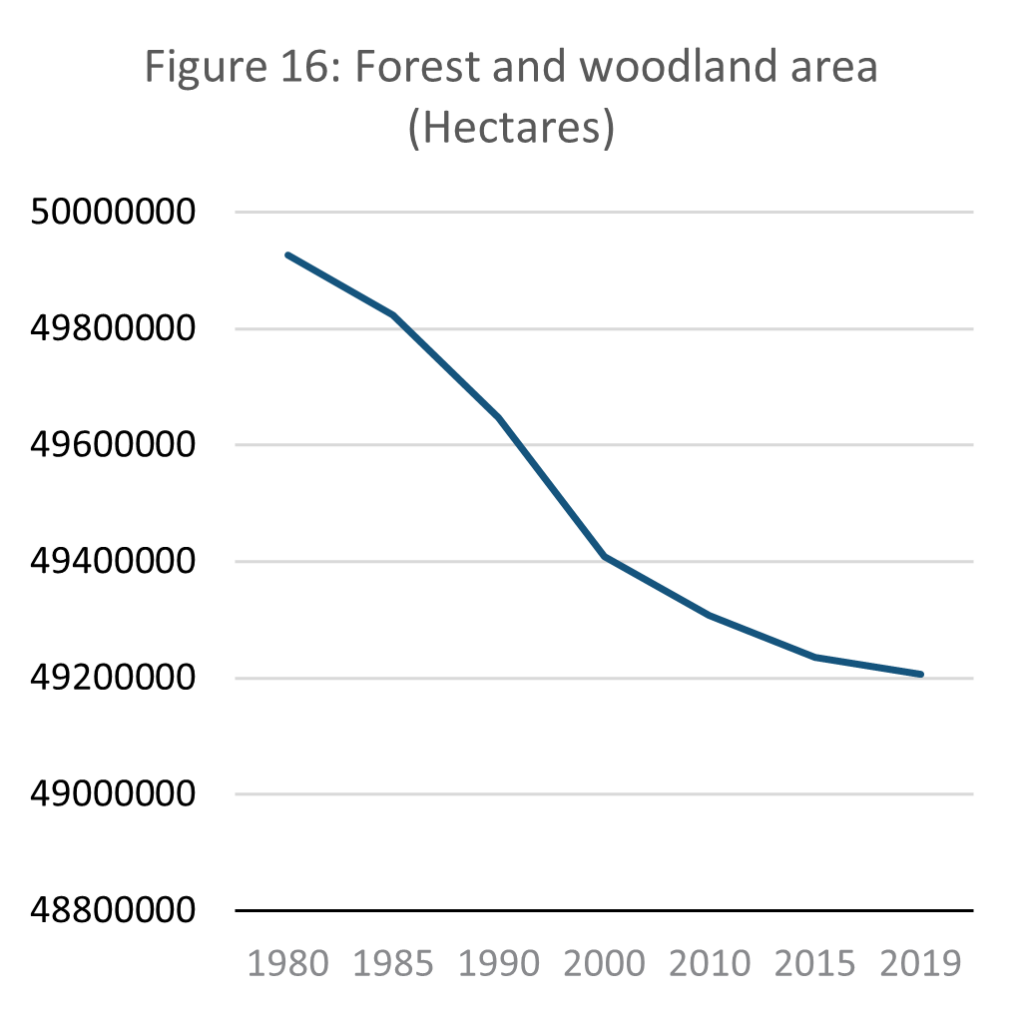
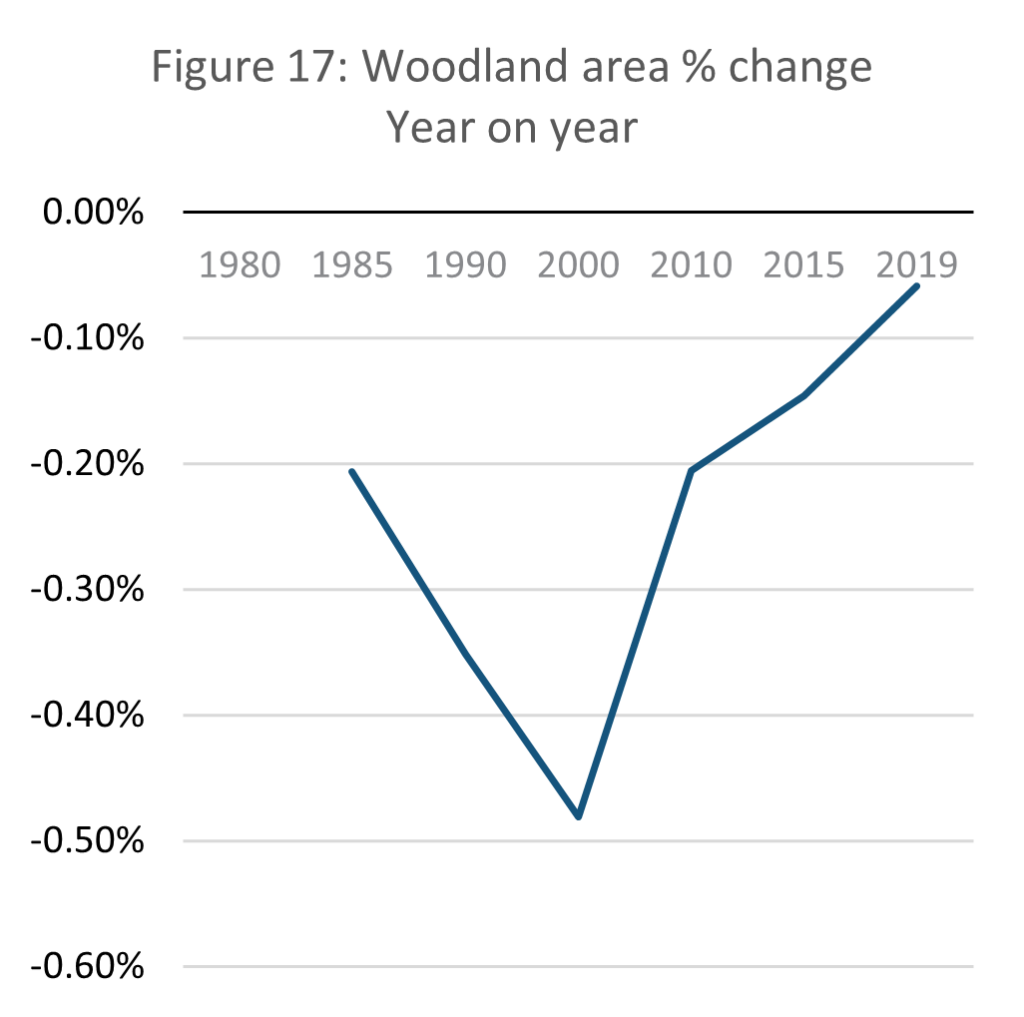
Above identifies that the scale of natural parks insufficiently models sustainable land use as regulation governing such land is flexible. This shortfall can be offset by directly analysing natural resource consumption from natural space. Narrowed down to national forest coverage the picture is mixed. As shown in the data above, forest and woodland area in Japan declined by 1.44% from 49.9 million hectares to 49.2 million. This is a relatively small change, and the pace at which forests are shrinking is also slowing. In 2019, year-on-year change in woodland area was only 0.06% away from stabilising completely. This trend suggests that Japan manages its forests increasingly sustainably, almost reaching a point of equilibrium.
However, this does not mean that Japan uses wood sustainably. Harvard University’s Atlas of Economic Complexity shows that Japan is heavily reliant on wood imports. In 2021, there was a total of USD 10.3 billion in wood imports to Japan, compared with only USD 472 million in exports (Growth Lab at Harvard University, 2022). As globalization expands and the importance of GVCs increase (Milberg, 2008) it becomes increasingly challenging to understand the impact that individual nations have on the environment. This is one of the key issues faced when assessing national sustainability.
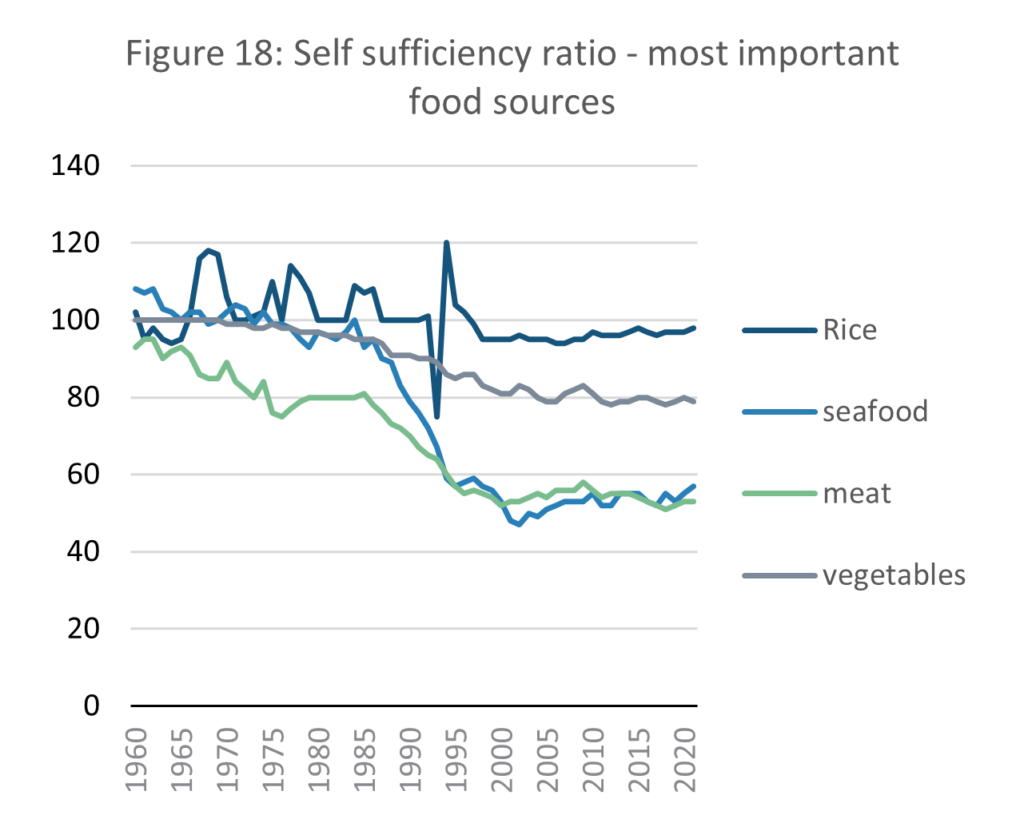
Source: E-stat – Statistics Bureau of Japan
The capability of a country to produce sufficient food for itself is dependent on land use. Agriculture requires land, regardless of how efficient farming is. It was shown above that in Japan’s attempts to limit deforestation, it is forced to import most of its wood supply. Below analyses whether Japan’s agricultural sector is self-sufficient, given land constraints.
The Statistics Bureau of Japan collects data for ‘self-sufficiency ratios’. This indicator measures the proportion of the economic value of food produced domestically, and domestic consumption of the same food (MAFF, N.D.) This paper has collected self-sufficiency data based on the importance of each food source. It acknowledges that some dietary factors are missing, such as fruit and grain produce other than rice, but has limited it to four variables deemed to hold the strongest impact on the sustainability of food resources.
Other than a temporary trough in 1993, Japan’s staple food of rice (MHLW, 2022) has remained at almost self-sufficient levels of production for as long as data is available. Since 1998 the self-sufficiency ratio in rice has maintained a level slightly below 100, indicating that Japan is reliant on only a small proportion of rice imports. The other key food sources are however not sustainable domestically. In 1960, Japan was self-sufficient in rice and vegetable production, while overproducing seafood. Only meat was slightly below self-sufficiency. This is no longer the case. The data suggest that Japan had to import 20% of its vegetable consumption and approximately half of its seafood and meat in 2020.
The self-sufficiency ratio for seafood fell by 67% between 1975 and 2019, from 9.6 million to 3.2 million. The Ministry for Agriculture, Forestry and Fisheries (MAFF) states that fish production peaked in 1984 but slowed by 1995, a statement supported by the self-sufficiency data. MAFF attributes this to falling Sardine reserves, a degradation of the environment in fishing regions, and the establishment of exclusive economic zones for fishing by other countries (MAFF, 2021). Although the decline in fish self-sufficiency has stopped, fish reserves have not replenished. MAFF attributes this to rising water temperatures and foreign fishing fleets (MAFF, 2021).
Ultimately, all stocks sit on a base of natural stock. Depletion of this natural stock therefore spells not only ecological but also economic disaster. Domestically speaking, Japan appears to manage its environment well, with designated natural space growing and deforestation slowing. However, closer analysis shows that environmental legislation is flexible and that natural resource extraction has shifted internationally via GVCs. This highlights how the SSE model can be misleading in a domestic context and is likely to be ineffective without it being adopted globally.
5. Throughput and services
In a theoretical SSE, throughput represents the metabolism of the economy – what must be consumed to maintain stocks. Services are what the economy produces for the benefit of society. Theoretically, throughput is minimised while services are maximised. This stands in contrast to the growth paradigm which while equally aiming to maximise the output of the economy, how that is achieved is deemed irrelevant.
While at first glance an economy such as Japan’s appears to be functioning well on ever slowing growth (The Economist, 2021; WEF, 2023) a deeper analysis of the outcomes of a slowing economy highlights pressures which are unlikely to be sustainable. This section firstly considers theoretically the challenges of understanding an economy in terms of throughput and services given the tools available to us. It then attempts to understand the dynamics of the Japanese economy in SSE terms, aiming to assess their analytical utility.
Problems of modelling throughput and services
Throughput and services collectively represent a similar concept to GDP and the circular flow of money in orthodox economics. However, in the SSE model throughput and services must be separable as the former must be minimised while the latter is maximised. This is difficult in practice as stocks and services are often difficult to differentiate. Both services and stocks must benefit society, or otherwise there would be no need to maintain them.
This becomes a significant issue logically – if services are to be maximised and stocks maintained at a steady level, a component of the economy which acts both as a stock and a service will inevitably fail at one of these two goals. Daly (1991, pp.36) argues “All services are yielded by stocks, not flows”. From this perspective the maximisation of services is limited to what is producible from limited stocks. This is arguably like orthodox economic logic, except that tangible limits are defined. Despite the doctrine of the scarcity of resources, orthodox economic theory tends to treat supply as infinite.
In aggregating consumption and production, GDP need not consider components of the economy which act simultaneously as services and stocks. Daly argues however that given stocks are maintained, a reduction in GDP implies a minimising of throughput (Daly, 1991, pp.18). – a statement which is mathematically sound so long as a way exists to prove stocks are indeed maintained.
In GDP there is therefore an imperfect indicator for throughput, but it tells us little about SSE services. Drawing on Daly’s argument that “human beings are rented rather than bought” (1991, pp.18) it is possible to proxy the dynamics of services to an extent via income data. Salaries represent how much employees are valued (even if not their relative contribution). “The service account would include the rental value of all existing members of the capital stock, not just those newly added. All assets would be treated in the same way that we treat owner-occupied houses in current GNP accounting-the services to the owner are estimated at an imputed equivalent rental value” (Daly, 1991, pp.18)
Assuming that throughput must precede services (throughput maintains stocks, which in turn build the base for which services can operate), GDP/GNP approaching but not falling below 0% growth must be a favourable condition. It is important to remember that in the SSE model, the purpose of throughput is to maintain stocks, not to accumulate as is the purpose in the growth economy.
If services are entirely accounted for by rental markets, this resolves issues of overproduction as there is no impulse to produce goods for every individual and less to persuade them to buy items they do not need. It is however problematic for power distribution. The emerging trend towards rentierism globally (Christophers, 2020) has shown that an economy dominated by rentiers can aggressively accentuate inequalities.
With a clearer boundary on how much of the economic pie is available, the only way for a firm or nation to increase its wealth (if it so chooses to) is to take from others. This is an existential problem for a country operating under SSE conditions while the world outside continues to operate on a growth paradigm. Domestically it may be possible to maintain steady conditions, but after a time it will be economically weak on an international stage.
If services must stem from a steady stock base, it follows that those services must be re-useable. Non-durable stocks are stocks with low service value, and in an economy with limitations on throughput the pace at which stocks can be replenished is slower.
As stated above, GDP assumes that production is equal to consumption. The ‘circularity of flows’ between producers and households ensures that the flow of money between producers and households is continuous and thus remains equal. Orthodox economics, emphasises consumption, as production should follow demand. Two problems arise from this in relation to this study. Assuming consumption is equal to production does not account for waste, whether entropic or simply discarded products. In the case of this study, Japan has a significant waste problem; in terms of food alone, Japan wastes 6.32 million tonnes of food annually (Kawai, 2017).
Production should be considered a throughput in the SSE model, while consumption fits better as a component of services. There is thus a conflict in logic. The SSE model demands keeping production to a minimum while maximising consumption, while orthodox economics states that their value will be the same. Using the term ‘consumption’ here obviously leads also to a framing issue. Suggesting that consumption should be maximised is clearly not the goal of the SSE.
Attempting to clearly differentiate between throughput and services does however highlight how closely related inputs and outputs in economic flows are. It is not always clear where throughput ends and services begin. Treating production and consumption as the same neglects waste and underplays overconsumption but separating them entirely fails to acknowledge their relationship. Daly’s (1992) SSE model does after all ultimately reduce to a ratio between maximised services and minimised throughput. This means that this study must utilise proxies for services and throughput individually but analyse the relationship between them.
Throughput and services in Japan
National
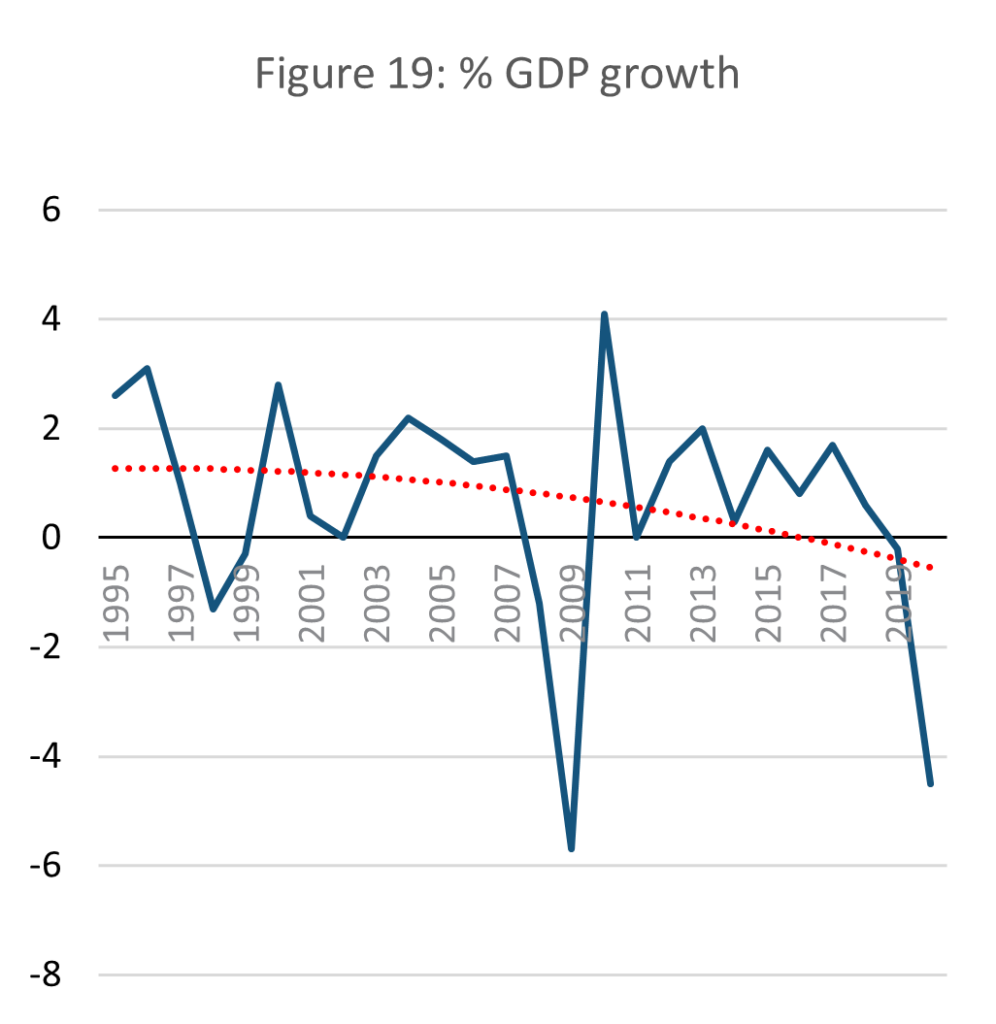
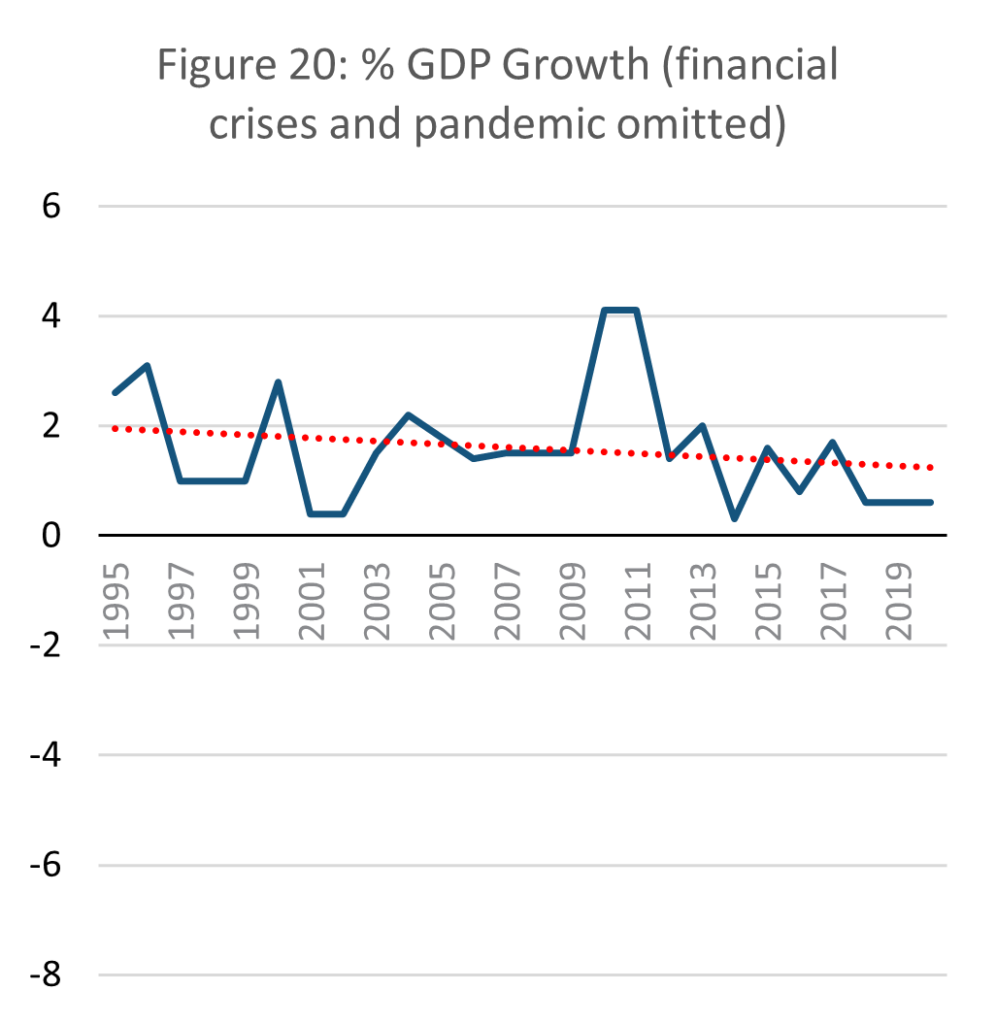
Source: E-stat – Statistics Bureau of Japan (Author’s calculations)
Following the above discussion, this paper opts to use GDP as an indicator for macro throughput dynamics, despite its shortfalls. GDP growth has not surpassed 2% annually since the 2008 financial crisis. In 2017 what little growth remained began to fall sharply, falling below 0% in 2019. While the negative growth in 2020 can be attributed to the Coronavirus pandemic, it had fallen into negative growth before the pandemic began.
The slowly decreasing GDP growth of Japan is thus a pressure on the possibility of maintaining a steady state. A regression analysis of the data shows that Japanese GDP has gradually slowed since 1995, crossing into negative in 2020. It is important to highlight that this is heavily influenced by the East Asian and Global financial crises, and recently the Coronavirus pandemic, which resulted in recessions. However, even if the recessions are omitted from the data to only represent ‘normal’ years, then it is clear long-term GDP growth is slowing nonetheless.
This highlights the inherent risk to an economy in being low throughput. Within the existing organisation of the global economy, negative growth inevitably leads to social instability as unemployment and relative costs rise. While some SSE literature argues for a controlled period of negative growth to slow economic metabolism (Meadows et al,1974) in Japan’s case negative growth was not planned, evidenced in the government’s concerted long-term efforts to reinvigorate growth (Kantei, 2010; Kantei, 2020). Japan’s negative growth pre-pandemic was however minimal and far from a crisis, especially considering its quick rebound post-pandemic (OECD, 2023).
Limits to Growth argued that a period of degrowth would be necessary for an SSE to reach a sustainable level (Meadows et al, 1972). Acknowledging this, it would be incorrect to label negative GDP growth as a failure of an economy approaching steady state. However, this study is concerned with the utility of an SSE model for understanding Japan currently and whether its economy is sustainable in its current form and is less concerned with predicting the future.
Households
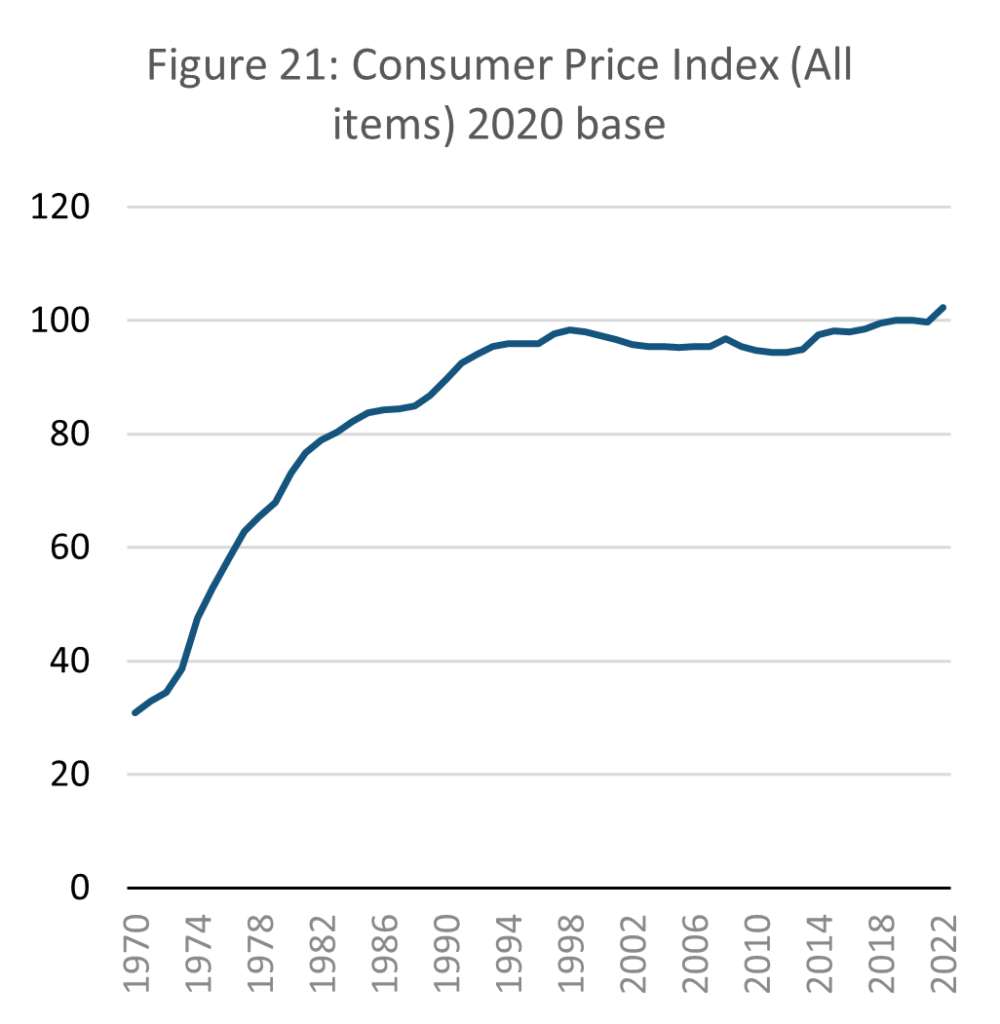
Source: E-stat – Statistics Bureau of Japan (author’s calculations)
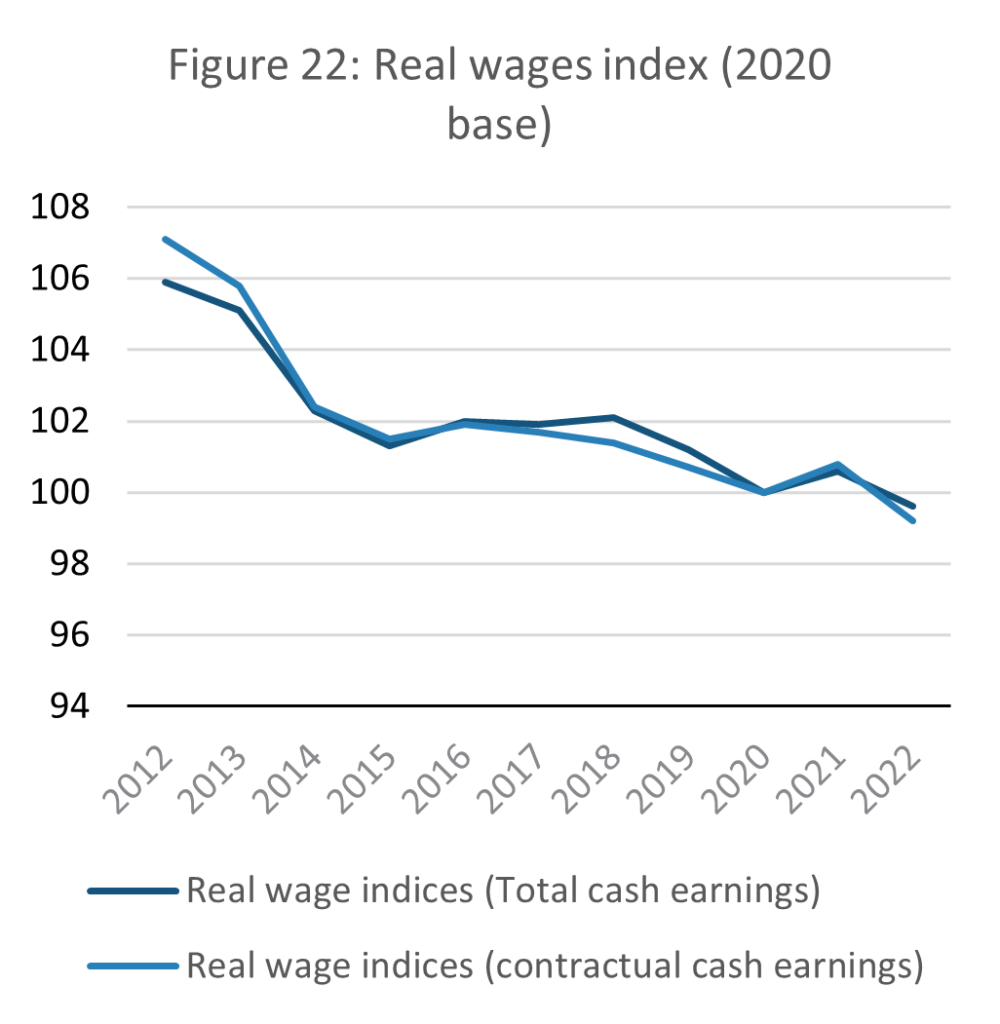
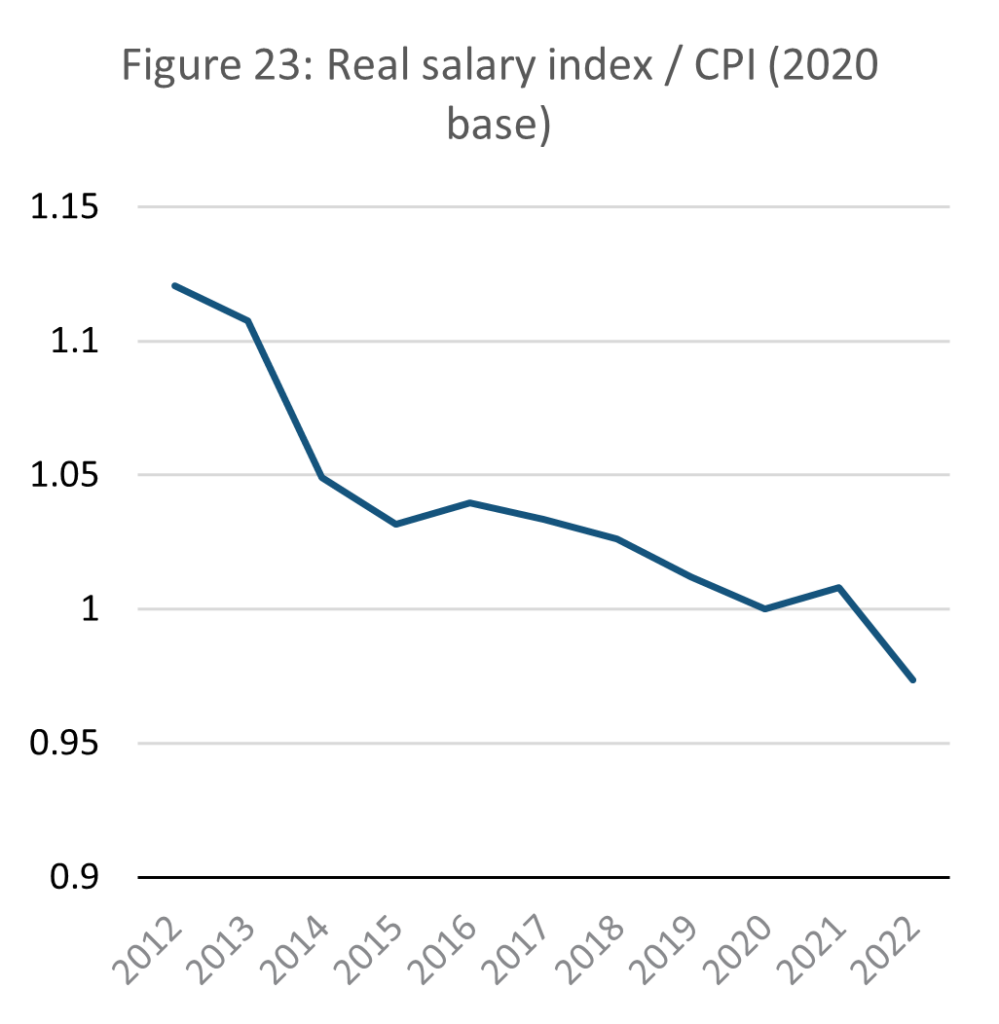
As explained above, the chosen indicators for representing services are income and the consumer price index. A sustainable SSE must theoretically maintain a steady ratio between prices and wages. If prices outstrip wages, then the material standard of living of citizens declines. If wages increase relative to prices, then consumers may consume more, defeating the point of the SSE.
As the data above shows, Japan’s Consumer price index (CPI) has remained relatively steady since the mid-1990s, which is a favourable condition for a theoretical SSE. In a no-growth economy, there should be no economic force driving up incomes. Wages however in real terms are in decline. When set in proportion to each other, the ratio of real wages to consumption price shows that the purchasing power of Japanese citizens is falling.
According to the Ministry of Economy, Trade and Industry (METI), it is individual consumers who are most affected by growth stagnation. As early as 2012, while national annual GDP growth was 1.2%, individual consumption growth was only 0.3%. This discrepancy between national and household income growth suggests a key challenge for realising a SSE, especially in an era of financialisation where increasingly fewer resources are directed towards salaries and individual consumers (Montgomerie and Tepe-Belfrage, 2017; Kohler et al, 2019). In the case that growth is close to 0%, in SSE terms if the economy is low throughput, then an economy oriented towards investment and financial products will likely result in progressively lower household incomes and thus a drop in living standards.
How Japanese society has responded to ‘stagnating’ growth appears however to go against the established wisdom that growth is necessary for improvement in wellbeing. Price rises in 2022 were deemed so unusual that companies were compelled to explain to consumers why – beforehand Japanese citizens consumed less with little complaint. The government however promoted inflation in an attempt to encourage national salary increases (Oi,2022). This indicates that growth is less essential to ensuring wellbeing as orthodox logic suggests and that steady prices can contribute to a stable society.
Despite this, the Japanese government remains growth-oriented, and its low throughput economy is deemed problematic. The period since the 1990s when economic growth first collapsed is known in Japan as ‘the lost 30 years’, including by policymakers (METI, 2023a). What METI calls ‘the new axis of economic and industrial policy’ (経済産業政策の新機軸) is oriented primarily towards reinvigorating growth despite an impending decline in population (METI, 2023a). This is to be achieved through investment in reskilling, startups and globalising Japanese society.
The desire for growth has its own unintended issues. In early 2023, inflation increased to 3.3%, the highest level in 41 years and overshooting the target of 2%, but salaries were slow to adjust. (Wada and Kihara, 2023). This leads to a double pressure, that of real wages falling while consumer prices rise.
Environment
The impetus for Daly’s (1992) SSE model was to envision a sustainable economy which mitigates the detrimental effect of human activity on the environment. Low throughput and high services are therefore not sufficient in isolation – what throughput there is must avoid burdening the environment. Due to a lack of space, this complex issue is simplified in this paper to only a consideration of Japan’s carbon emissions, so chosen as they represent the most pressing form of environmental degradation globally and the core driver of climate change. They also function effectively as an indicator of national impact on climate change.
Source: E-stat – Statistics Bureau of Japan
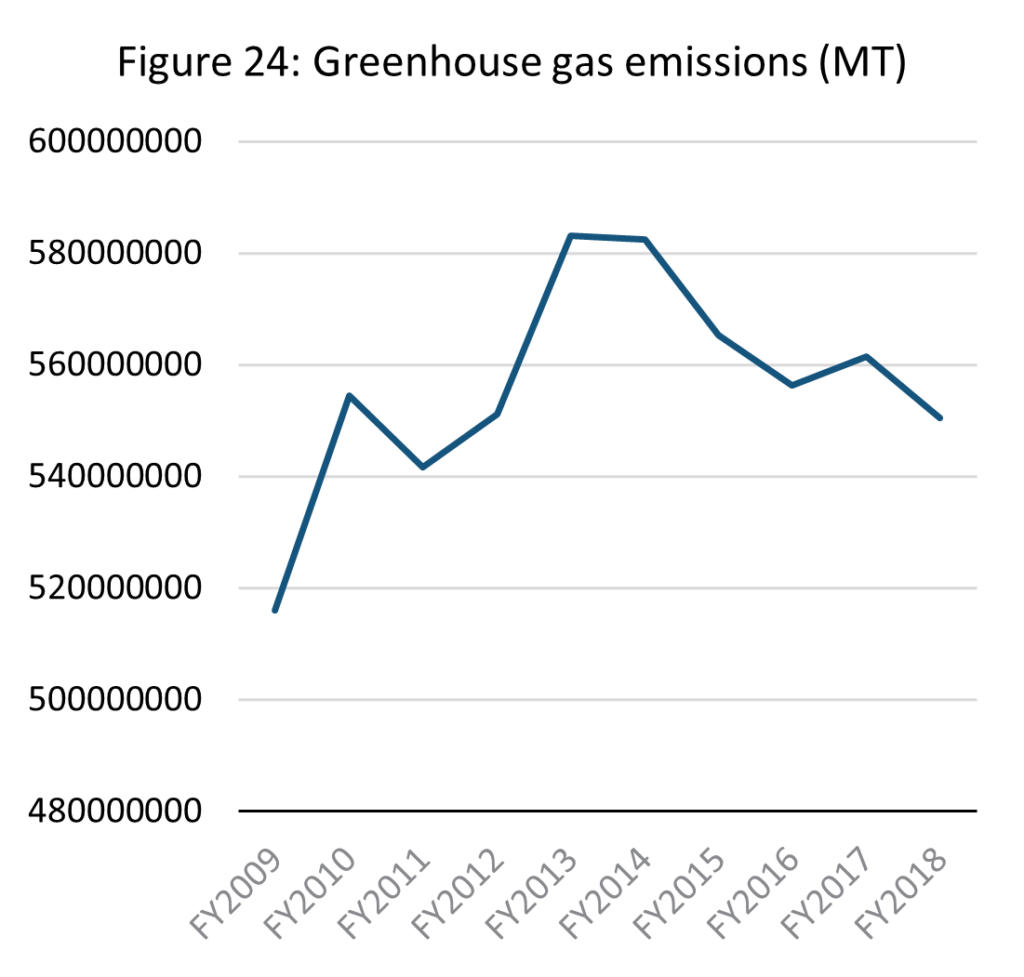
Japan is the 5th largest emitter of greenhouse gases globally, and 34th on a per capita basis (EDGAR, 2022). Emissions peaked in 2013 and have fallen gradually since. It remains however 6.7% higher than in 2009, the first year of available data. A significant issue within the scope of this paper is conclusively identifying a causative link between decreasing economy throughput and the reduction in national greenhouse emissions. It does however seem that whether slowing economic throughput is a factor in reducing greenhouse gas emissions, it cannot be the driving factor. As is clear in the GDP and consumption data above, where GDP and purchasing power have slowed for decades, greenhouse emissions only began to fall since 2013.
Source: E-stat – Statistics Bureau of Japan (author’s calculations)
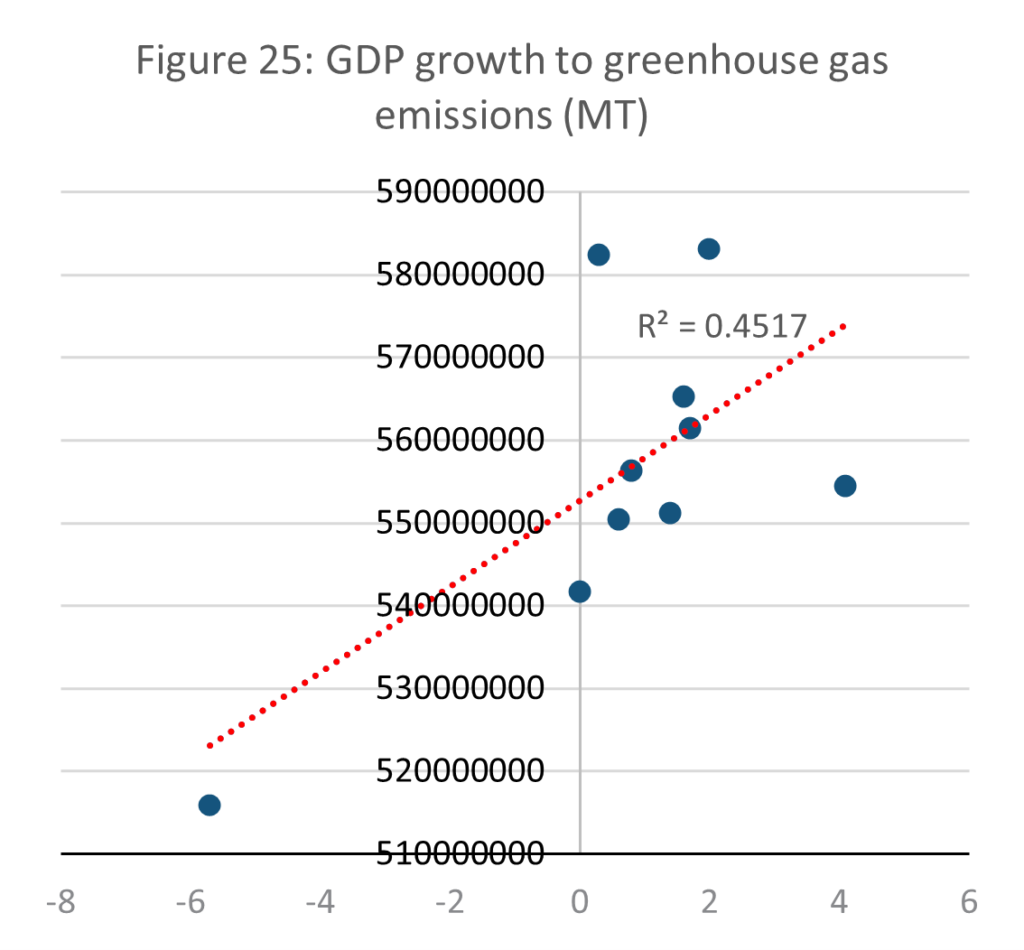
Mapping Japan’s GDP growth to its emissions corroborates this, resulting in only a very slight correlation indicated by R2 = 0.4517. It is however important to note that at times of recession, such as when annual GDP growth contracted to -6%, greenhouse gas emissions were considerably lower than at times of higher growth. The same trend was identified globally during the Coronavirus pandemic, as pollution levels dropped significantly in industry-heavy nations (Nature, 2020).
The conditions for the 2009 financial crisis and the Coronavirus pandemic were however different. While the economy struggled during both, the pandemic restricted industry and transport physically and heavy polluters such as factories and flights ceased to operate. In the financial crisis, industry did not stop. This indicates that while the correlation between GDP growth and emissions in Japan is relatively weak, heavy disruption to production can reduce emissions.
Sustainability, not disruption, is the aim of the SSE model. It is thus important to question whether an SSE is equipped to reduce emissions. Up to now only outright collapse of GDP growth has significantly dropped emissions in Japan, giving credence to degrowth proponents who believe shrinking the economy is the only way to reach a sustainable world economy (Latouche, 2009; Kallis, 2011).
On one hand the data show that Japan has reduced emissions (EDGAR, 2022) while targetting economic growth (METI, 2023a). On the other hand, emission reductions have been limited, and there is not yet evidence to show Japan would continue to keep emissions low if its circular economy plan were realised. Evidence as of yet suggests the ideal of growth and emission reductions has not materialised anywhere (Jackson, 2011; Schneider et al, 2010). It is clear that a steady population level and close to 0% growth is not sufficient to bring emissions under control without additional structural developments, whether in the form of societal change or technological advance.
Japan’s emission reduction policy and the extent to which they coexist with SSE ideals should be analysed in conjunction with the above data. Japan’s 2014 energy plan targetted the following issues: overcoming dendency on energy imports with self sufficiency seen as a way of reducing the impact of external shocks; changing energy demand structure due to demographic change; energy cost instability as emerging countries’ energy requirements change; the global need to curb carbon emissions, and the fear of nuclear energy following Fukushima nuclear disaster (METI, 2014).
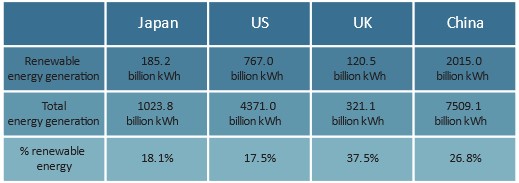
Figure 26: % Renewable energy generation
Source: METI, 2021
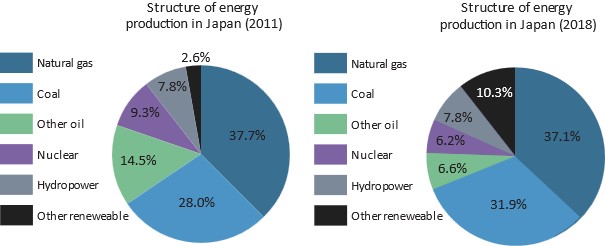
As of 2019, Japan lagged behind other major economies in the shift to renewable energy, renewable sources only accounting for 18.1% of total energy supply. This compared to 37.5% in the UK and 26.8% in China. Japan’s electricity capacity was 3.2 times higher than in the UK, and overall produced 35% more renewable energy than the UK (METI, 2021). Reducing emissions was however not the priority. While the energy strategy increased the share of renewable energy – between 2011 and 2019 by 7.7% – natural gas use stayed almost the same and coal usage increased by 3.9%. Instead of addressing emissions, Japan reduced the share of nuclear energy. The strategy up to 2050 targets an 85% reduction in carbon emissions, but the above data suggests Japan is unlikely to achieve this.
Figure 27: Structure of energy production in Japan
Source: METI, 2021
The core tension between Japan’s energy policy and the SSE model is investment. If reducing energy capacity and output is not an option, then tremendous resources are required to transform the energy sector into a green sector. Without increasing economic throughput as a whole, realising such a transformation is implausible. Nuclear energy, in emission terms a clean energy source, is too politically sensitive after the Fukushima disaster to be a viable mid-term response to overuse of fossil fuels and is accordingly being phased out. There is an evident unwillingness to transform the fossil fuel sector, evidenced in near to no change in these sources between 2011 and 2018. Commitments to reducing emissions therefore have likely thus far been tokenistic.
Japan’s response to energy and emission challenges has little common ground with the SSE model. As a society with extremely high energy consumption and little desire to change that, escaping a growth model which allows for long-term investment proves difficult. This highlights a paradox with green growth whereby innovating for a future with less impact on the environment forces governments to degrade it further now. That said, Japan’s limited emission reductions have thus far stemmed from innovation and investment into renewable energy, even if progress leaves Japan far from its 2050 targets of 85% emissions reduction (METI, 2021).
6. Conclusion
This paper asked to what extent a theoretical steady state economy (SSE) could function given the existing global economic system. It analysed the utility of Daly’s (1992) SSE model in relation to Japan, used as a case study due to it exhibiting a macroeconomic structure similar to the SSE model. This research mapped key macroeconomic processes into the SSE terms of stocks, services and throughput and then analysed to what extent these processes functioned as an SSE would demand, namely that stocks are maintained at a sustainable level, while throughput is minimised and services maximised.
This paper found that while Japan loosely resembles an SSE at the macro level, flatlining population and economic growth has created numerous unsustainable pressures within the economy. It also found that we are not yet equipped with effective tools to fully analyse an economy in SSE terms. At the core of this issue is that orthodox economic analysis tends not to clearly differentiate between throughput and services, resulting in significant barriers when a researcher attempts to separate them.
While population may be stable, population distribution has shifted and Japan’s increasingly aging demographics pose profound challenges to its future workforce and thus economic stability. Analysed from a national perspective, Japan appears to manage its natural stocks highly effectively, but further analysis exposes that Japan is heavily reliant on imports to maintain its own stocks.
Slowing economic growth should represent a stabilisation of throughput in the SSE model, but for Japan this has resulted in economic pressure for households as real salaries have fallen. At a national level, low growth means that Japan has little safety net in times of recession, representing a destabilising factor in SSE logic. Japan’s low growth rates have also provided a meaningful downward pressure on its emissions, only significantly affecting them during major recessions. Steady population and low growth are not sufficient in themselves to bring emissions under control.
This paper needed to make numerous compromises in order create proxies for Daly’s model. It is clear that the orthodox global economic structure is tangential enough from the ideals of an SSE that existing economic assumptions and indicators struggle to express meaningful insights.
Where Daly attempts to separate stocks from throughput, it is deeply challenging to achieve this analytically with existing economic indicators. GDP is the greatest example of this, as it amalgamates Daly’s stocks and throughput together. Existing indicators are especially poorly equipped to analyse capital stocks. Daly’s (1992) proposition of using net capital formation is insufficient and there is no consensus yet on emerging ‘wealth’ indicators that offer the closest alternative.
This leads to the conclusion that new indicators must be developed before it is possible to meaningfully track the aims and processes of an SSE. These will be very challenging to develop without a rethinking on what we prioritise within the economy. Through considering which available government data are valuable to describing the Japanese economy in SSE terms, it becomes clear that we understand the economy through established tools and not necessarily the most effective tools. In practice this means governments are highly equipped to analyse from a growth economy perspective, but less well equipped to think outside the growth paradigm.
Further research into how a national SSE economy could interact with the global economy is required. Trade flows and offsetting of environmental impact are for example major considerations for assessing the utility and value of the SSE model at a global level, but this was outside the scope of this paper.
Bibliography
Arboleda, M. (2020). Planetary Mine: Territories of Extraction under Late Capitalism. Verso.
Bennet Institute. (2020). Valuing wealth, building prosperity. Bennet Institute for Public Policy Cambridge. Retrieved from: https://www.bennettinstitute.cam.ac.uk/wp-content/uploads/2020/12/WER_layout_March_2020_ONLINE_FINAL_Pdf_1.pdf.
Christophers, B. (2020). Rentier Capitalism: Who owns the economy, and who pays for it?. Verso.
Cosme, I., Santos, R., and O’Niell, D.W. (2017). Assessing the degrowth discourse: A review and analysis of academic degrowth policy proposals. Journal of Cleaner Production. 149. 321-334.
Creswell, J. W. (2014). Research design: qualitative, quantitative, and mixed methods approaches (Fourth edition, International student edition.). SAGE.
Daly, H.E. (1992). Steady-state economics. London: Earthscan Publications Ltd.
Economist. (2021). Japan’s economy is stronger than many realise. The Economist. Retrieved from: https://www.economist.com/special-report/2021/12/07/japans-economy-is-stronger-than-many-realise.
EDGAR. (2022). IEA-EDGAR CO2, a component of the EDGAR (Emissions Database for Global Atmospheric Research) Community GHG database version 7.0. Retrieved from: https://edgar.jrc.ec.europa.eu/report_2022?vis=tot#emissions_table.
E-gov. (1957). 自然公園法. Retrieved from: https://elaws.e-gov.go.jp/document?lawid=332AC0000000161.
E-Stat. (N.D). E-stat – Statistics Bureau of Japan. Retrieved from: https://dashboard.e-stat.go.jp/en/dataSearch.
Escobar, A. (2015). Degrowth, postdevelopment, and transitions: a preliminary conversation. Sustainability Science, 10(3), 451–462.
Foster, J. B. (2000). Marx’s Ecology: Materialism and Nature. New York, Monthly Review Press.
Georgescu-Roegen N. (1971). The entropy law and the economic process. Cambridge Mass: Harvard University Press.
Girvan, N. (2014). Extractive Imperialism in Historical Perspective. In Petras, J., and Veltmeyer, H. (Ed.) Extractive Imperialism in the Americas: Capitalism’s New Frontier. Brill.
Growth Lab at Harvard University. (2022). The Atlas of Economic Complexity. Retrieved from: https://atlas.cid.harvard.edu/explore?country=114&queryLevel=location&product=143&year=2021&productClass=HS&target=Product&partner=undefined&startYear=undefined.
Gudynas, E. (2011). Buen Vivir: Today’s tomorrow. Development (Society for International Development), 54(4), 441–447.
Gudynas, E. (2018). Extractivisms: Tendencies and consequences. In Reframing Latin American Development. Routledge.
Herath, A. (2016). Degrowth: a literature review and a critical analysis. International Journal of Accounting & Business Finance. 1.
Hickel, J. (2020) Less is More: How Degrowth will Save the World. Penguin Random House UK.
Hueting, R., 2010. Why environmental sustainability can most probably not be attained with growing production. Journal of Cleaner Production. 18 (6), 525–530.
IEA. (2023). CO2 Emissions in 2022. International Energy Agency.
IISD. (2021). Measuring the Wealth of Nations: A review. International Institute for Sustainable Development. Retrieved from: https://www.iisd.org/publications/report/measuring-wealth-nations-review.
IPCC. (2018).Global Warming of 1.5 C. International panel on Climate Change. Retrieved from: htps://www.ipcc.ch/site/assets/uploads/sites/2/2022/06/SR15_Full_Report_HR.pdf. (Accessed 24 March 2023).
Ingold, T. (2000) The perception of the environment: essays on livelihood, dwelling and skill. London, Routledge.
Jackson, T. (2011). Prosperity without growth: Economics for a finite planet. Routledge.
Jevons, W. S. (1866). The coal question. Macmillan and co.
Kallis, G. (2011). In defence of degrowth. Ecological Economics, 70(5), 873-880.
Kankyo. (2017). 自然公園とは. Tokyo Bureau of Environment. Retrieved from: https://www.kankyo.metro.tokyo.lg.jp/naturepark/know/park/about.html.
Kantei. (2020). 成長戦略フォローアップ. Prime Minister’s office of Japan. Retrieved from: https://www.cas.go.jp/jp/seisaku/seicho/pdf/fu2021.pdf.
Kantei. (2010). 新成長戦略:「元気な日本」復活のシナリオ. Prime Minister’s office of Japan. Retrieved from: https://www.kantei.go.jp/jp/sinseichousenryaku/sinseichou01.pdf.
Kawai, R. (2017). 食品ロスの削減に向けて食べものに,もったいないを,もう一度. Japan Society for Bioscience, Biotechnology and Agrochemistry.
Kerschner, C. (2010). Economic de-growth vs. steady-state economy. Journal of Cleaner Production, 18(6), 544-551.
Keynes, M. (1936). The general theory of employment interest and money. Macmillan.
Kimura, Y. (2022).自民党の外国人労働者政策―回顧と展望―.グローバル・コンサーン. Retrieved from: https://www.jstage.jst.go.jp/article/globalconcern/5/0/5_10/_pdf/-char/ja.
Kohler, K., Guschanski, A., and Stockhammer, E. (2019). The impact of financialisation on the wage share: a theoretical clarification and empirical test. Cambridge Journal of Economics, 43(4). 937-974.
Latouche, S. (2009). Farewell to Growth. Polity, Cambridge.
MAFF. (2021). 漁獲量が減少している理由をおしえてください. Japan Ministry of Agriculture, Forestry and Fisheries. Retrieved from: https://www.maff.go.jp/j/heya/kodomo_sodan/0007/04.html.
MAFF. (N.D). 食料自給率とは. Japan Ministry of Agriculture, Forestry and Fisheries. Retrieved from: https://www.maff.go.jp/j/zyukyu/zikyu_ritu/011.html.
Malthus, T. R. (1798). An essay on the principle of population or, A view of its past and present effects on human happiness, with an inquiry into our prospects respecting the future removal or mitigation of the evils which it occasions. Reeves and Turner.
Martinez-Alier, J. (2010). Environmental justice and economic degrowth. An Alliance between Two Movements. Paper presented at the CES Conference on The Revival of Political Economy, Coimbra, 21–23 October 2010.
Meadows, D.H., et al. (1974). The Limits to growth: a report for the Club of Rome’s Project on the Predicament of Mankind. Universe Books.
METI. (2014). エネルギー基本計画(2014 年 4 月 11 日 閣議決定). Ministry of Economy, Trade and Industry. Retrieved from: https://www.enecho.meti.go.jp/about/whitepaper/2014pdf/whitepaper2014pdf_1_3.pdf.
METI. (2021). 2030年に向けた今後の再エネ政策. Ministry of Economy, Trade and Industry. Retreived from: https://www.enecho.meti.go.jp/category/saving_and_new/saiene/community/dl/05_01.pdf.
METI. (2023a). 経済産業政策新機軸部会第2次中間整理 参考資料集. Japanese Ministry of Economy, Trade, and Industry. Retrieved from: https://www.meti.go.jp/shingikai/sankoshin/sokai/pdf/032_s02_03.pdf.
METI. (2023b). 成長志向型の資源自律経済戦略の概要. Japanese Ministry of Economy, Trade and Industry. Retrieved from: https://www.meti.go.jp/shingikai/energy_environment/shigen_jiritsu/pdf/20230331_2.pdf.
MHLW. (2022). 日本人の栄養と健康の変遷. Japan Ministry for Health, Labour and Welfare. Retrieved from: https://www.mhlw.go.jp/content/000894103.pdf.
MHLW. (N.Da). 我が国の人口について. Japan Ministry for Health, Labour and Welfare. Retrieved from: https://www.mhlw.go.jp/stf/newpage_21481.html#:~:text=%E6%8E%A8%E7%A7%BB%E3%81%A8%E8%A6%8B%E7%9B%B4%E3%81%97-,%E4%BA%BA%E5%8F%A3%E3%81%AE%E6%8E%A8%E7%A7%BB%E3%80%81%E4%BA%BA%E5%8F%A3%E6%A7%8B%E9%80%A0%E3%81%AE%E5%A4%89%E5%8C%96,%E3%81%AA%E3%82%8B%E3%81%A8%E6%8E%A8%E8%A8%88%E3%81%95%E3%82%8C%E3%81%A6%E3%81%84%E3%81%BE%E3%81%99%E3%80%82.
MHLW. (N.Db.). 定年制等. Japan Ministry for Health, Labour and Welfare. Retrieved from: https://www.mhlw.go.jp/toukei/itiran/roudou/jikan/syurou/05/3-4.html.
Milberg, W. (2008). Shifting Sources and Uses of Profits: Sustaining US Financialization with Global Value Chains. Economy and Society. 37 (3), 420-51.
Mill, J. S. (1848). Principles of political economy: with some of their applications to social philosophy. Parker.
Montgomerie, J., and Tepe-Belfrage, D. (2017). Caring for Debts: How the Household Economy Exposes the Limits of Financialisation. Critical Sociology. 43(4-5). 653-668.
MUFG. (2021). 日本経済の中期見通し(2021~2030 年度). Mitsubishi UFG Bank. Retrieved from: https://www.murc.jp/wp-content/uploads/2021/10/news_release_211013.pdf.
Nature. (2020). How the coronavirus pandemic slashed carbon emissions – in five graphs. Nature. Retrieved from: https://www.nature.com/articles/d41586-020-01497-0.
Nikkei. (2021). 移民問題とは?日本と欧州の移民問題を過去記事から振り返る. Nikkei Business. Retrieved from: https://business.nikkei.com/atcl/gen/19/00081/051100187/.
NRI. (2023).外国人1割社会で日本経済は再生できるか?.Nomura Research Institute. Retrieved from: https://www.nri.com/jp/knowledge/blog/lst/2023/fis/kiuchi/0626.
OECD. (2020). Hows Life? 2020. Organisation for Economic Co-operation and Development. Retrieved from: https://www.oecd.org/wise/how-s-life-23089679.htm.
OECD. (2023). Real GDP forecast (indicator). Organisation for Economic Co-operation and Development. Retrieved from: https://data.oecd.org/gdp/real-gdp-forecast.htm.
Oi, M. (2022). Cost of living: The shock of rising prices in Japan. BBC. Retrieved from: https://www.bbc.co.uk/news/business-61718906.
O’Neill, D. W. (2012). Measuring progress in the degrowth transition to a steady state economy. Ecological Economics, 84, 221-231.
Peterson, E.W.F. (2017). The Role of Population in Economic Growth. SAGE Open, 7(4).
Piketty, T. (2014). Capital in the twenty-first century. Cambridge, MA: Belknap Press of Harvard University Press.
Piketty, T. (2015). About capital in the twenty-first century. American Economic Review, 105(5), 48-53. ISI.
Research & Degrowth. (2010). Degrowth Declaration of the Paris 2008 conference. Journal of Cleaner Production. 18 (6), 523–524.
Rockström, J., Gupta, J., Qin, D. et al. (2023). Safe and just Earth system boundaries. Nature .
Saito, K. (2020). 人新世の「資本論」. Shueisha Shinsho.
Schumpeter, J.A. (1911). The Theory of Economic Development: An Inquiry into Profits, Capital, Credit, Interest, and the Business Cycle. Harvard Economic Studies.
Schneider, F., Kallis, G., Martínez-Alier, J. (2010). Crisis or opportunity? Economic degrowth for social equity and ecological sustainability. Introduction to this special issue. Journal of Cleaner Production 18 (6), 511–518.
Se, T. (2018). 欧州「移民受け入れ」で国が壊れた4ステップ. Toyo Keizai. Retrieved from. https://toyokeizai.net/articles/-/256915.
Steffen, W., Richardson, K., Rockstrom, J., et al. (2015). Planetary boundaries: guiding human development on a changing planet. Science. 1259855.
Stern, N. (2006). The economics of climate change: The Stern review. Retrieved from http://webarchive.nationalarchives.gov.uk/+/http://www.hmtreasury.gov.uk/stern_review_report.htm.
Taylor, M. (2015). The Political Ecology of Climate Change Adaptation. Abingdon: Routledge.
UN. (2022). Why population growth matters for sustainable development. United Nations Department of Economic and Social Affairs. Retrieved from: https://www.un.org/development/desa/pd/sites/www.un.org.development.desa.pd/files/undesa_pd_2022_policy_brief_population_growth.pdf.
UNPD. (2022). World Population Prospects 2022. United Nations Department of Economic and Social Affairs Population Division. Retrieved from https://population.un.org/wpp/Graphs/DemographicProfiles/Line/900.
Van den Bergh, J. C. (2011). Environment versus growth—A criticism of “degrowth” and a plea for “a-growth”. Ecological Economics, 70(5), 881-890.
Wada, T., and Kihara, L. (2023). Japan’s consumer inflation off 41-year high but cost pressure persists. Reuters. Retrieved from: https://www.reuters.com/markets/asia/japans-consumer-inflation-off-41-year-high-stays-above-boj-goal-2023-03-23/.
Wackernagel, M., Rees, W.E. (1996). Our Ecological Footprint: Reducing Human Impact on the Earth. New Society Publishers, Gabriola Island, BC, Canada.
WEF. (2017). The Inclusive Growth and Development Report. World Economic Forum. Retrieved from: https://www3.weforum.org/docs/WEF_Forum_IncGrwth_2017.pdf.
WEF. (2023). 日本が世界に誇るべき「安定性」. World Economic Forum Japan. Retrieved from: https://jp.weforum.org/agenda/2023/01/jp-japan-s-greatest-export-today-stability/.
Woo, R. (2023). Why Japan continues to be a land for optimism. Japan Times. Retrieved from: https://www.japantimes.co.jp/opinion/2023/03/15/commentary/world-commentary/japanese-investment-environment/#:~:text=Geopolitical%20trends%2C%20primarily%20the%20decoupling,strategic%20location%20in%20bustling%20Asia%3B.
World Bank. (2021). The changing Wealth of Nations 2021: Managing Assets for the Future. World Bank. Retrieved from: https://openknowledge.worldbank.org/entities/publication/e1399ed3-ebe2-51fb-b2bc-b18a7f1aaaed.
World Bank, (N.Da). Population growth (annual %) – Japan. World Bank Data. Retrieved from https://data.worldbank.org/indicator/SP.POP.GROW?locations=JP&most_recent_value_desc=false.
World Bank, b (N.Db). GDP growth (annual %) – Japan, World, Korea, Rep., China. World Bank Data. Retrieved from https://data.worldbank.org/indicator/NY.GDP.MKTP.KD.ZG?locations=JP-1W-KR-CN&most_recent_value_desc=false.
Zhu, K., and Jiang, X. (2019). Slowing down of globalization and global CO2 emissions – A causal or casual association?. Energy Economics. 84. 1044873.

